Introduction
In nuclear facilities, the containment building is an essential civil engineering structure designed to isolate the reactor and ensure the safety of the facility. Although its function remains the same, the geometry of the containment building—whether cylindrical, spherical, or mixed—varies depending on design choices. These variations in shape influence not only the quantities of materials and structural behavior, but also the complexity of construction and maintenance operations, which represent a major part of the life cycle of such a structure.
As part of this project, the analysis therefore focuses on different shapes of containment structures in order to assess their impact on the life cycle, costs, and maintenance operations, and to compare these options using a multi-criteria analysis to inform decision-making in the design phase.
Design Options
In the first project, we modeled the containment building of a typical French nuclear power plant equipped with a 900 MWe reactor. For the present analysis, we are limiting ourselves to studying the concrete wall of this containment building. We retain the physical and chemical characteristics established previously, namely a 1-meter-thick wall of C30/37 prestressed concrete (workability S4, grain size Dmax = 20 mm).
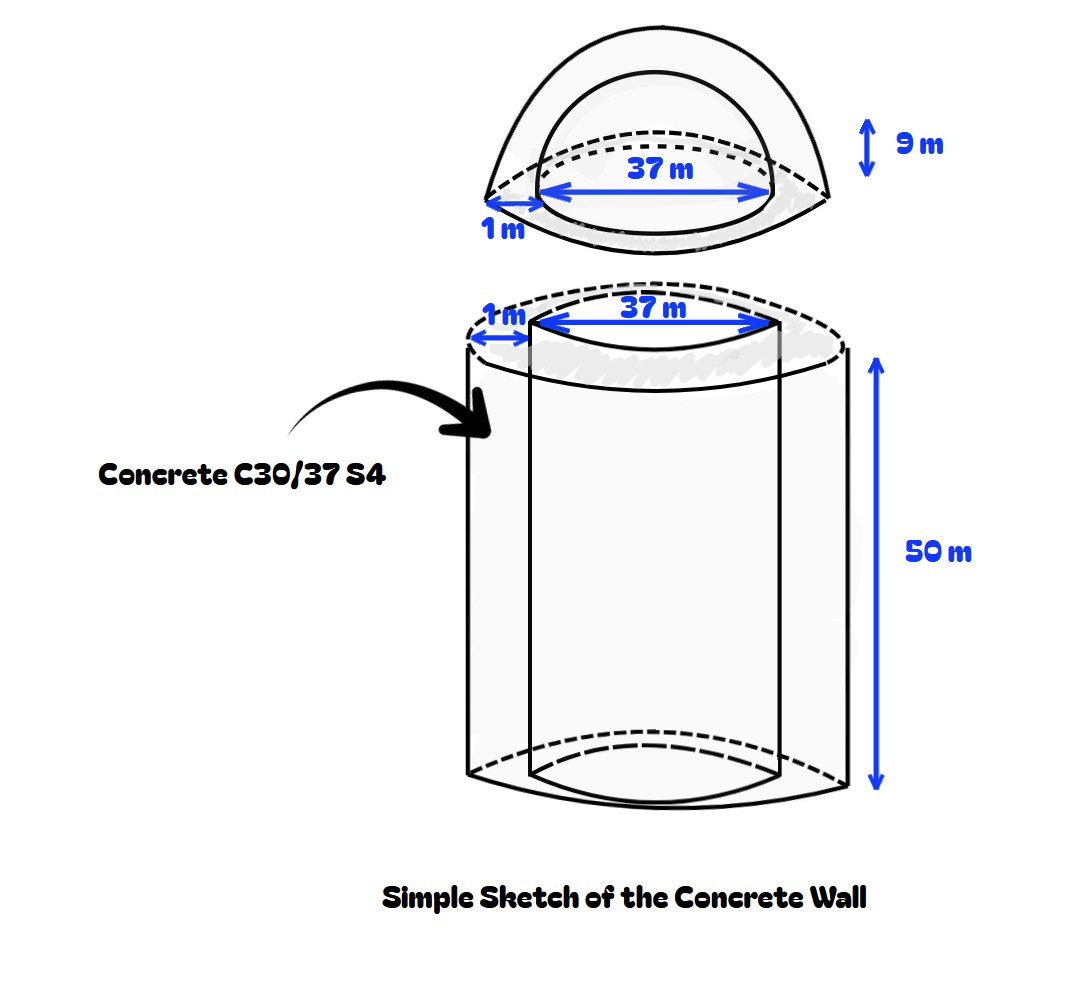
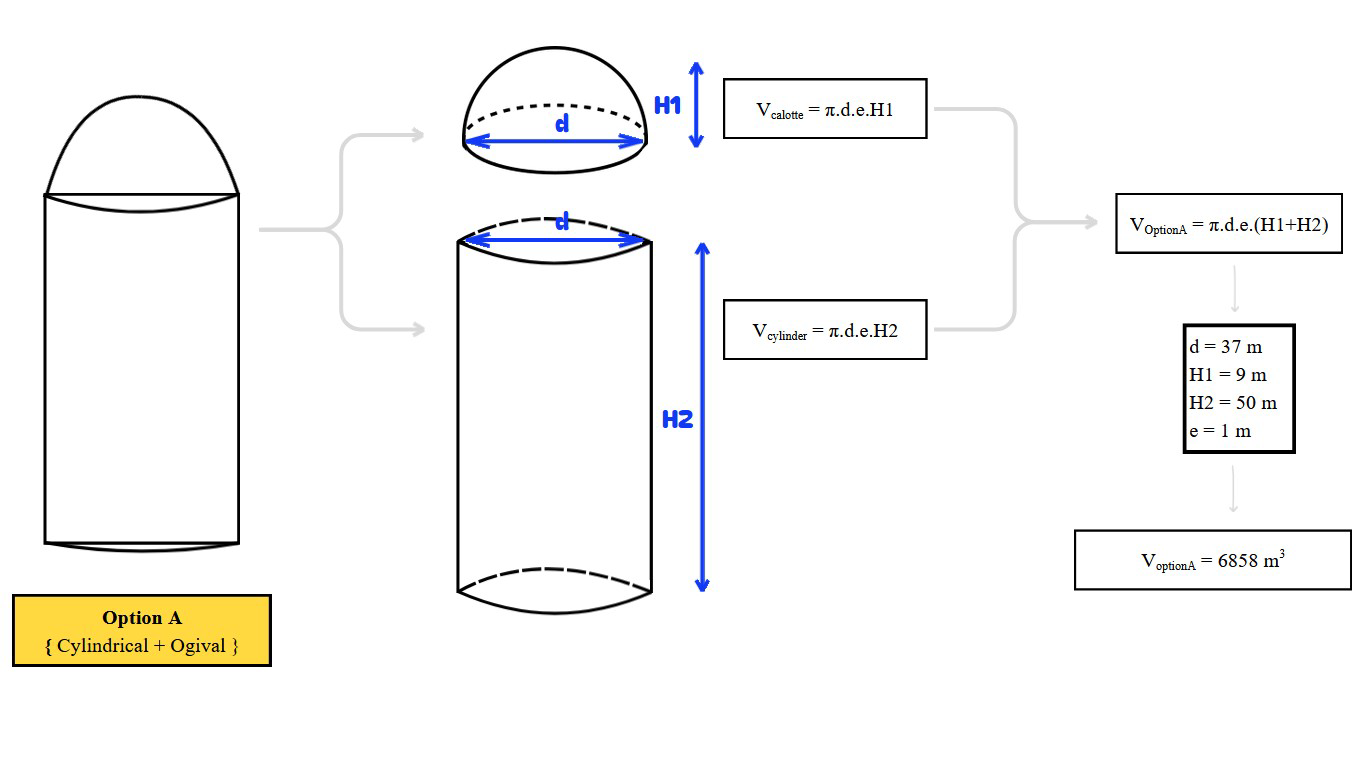
The containment structures for the REP 900 project mainly consist of a cylindrical prestressed concrete building approximately 37 m in diameter and 59 m high [1]. For the purposes of our modeling, we have arbitrarily chosen a dome height of 9 m, which gives a height of 50 m for the cylindrical section.
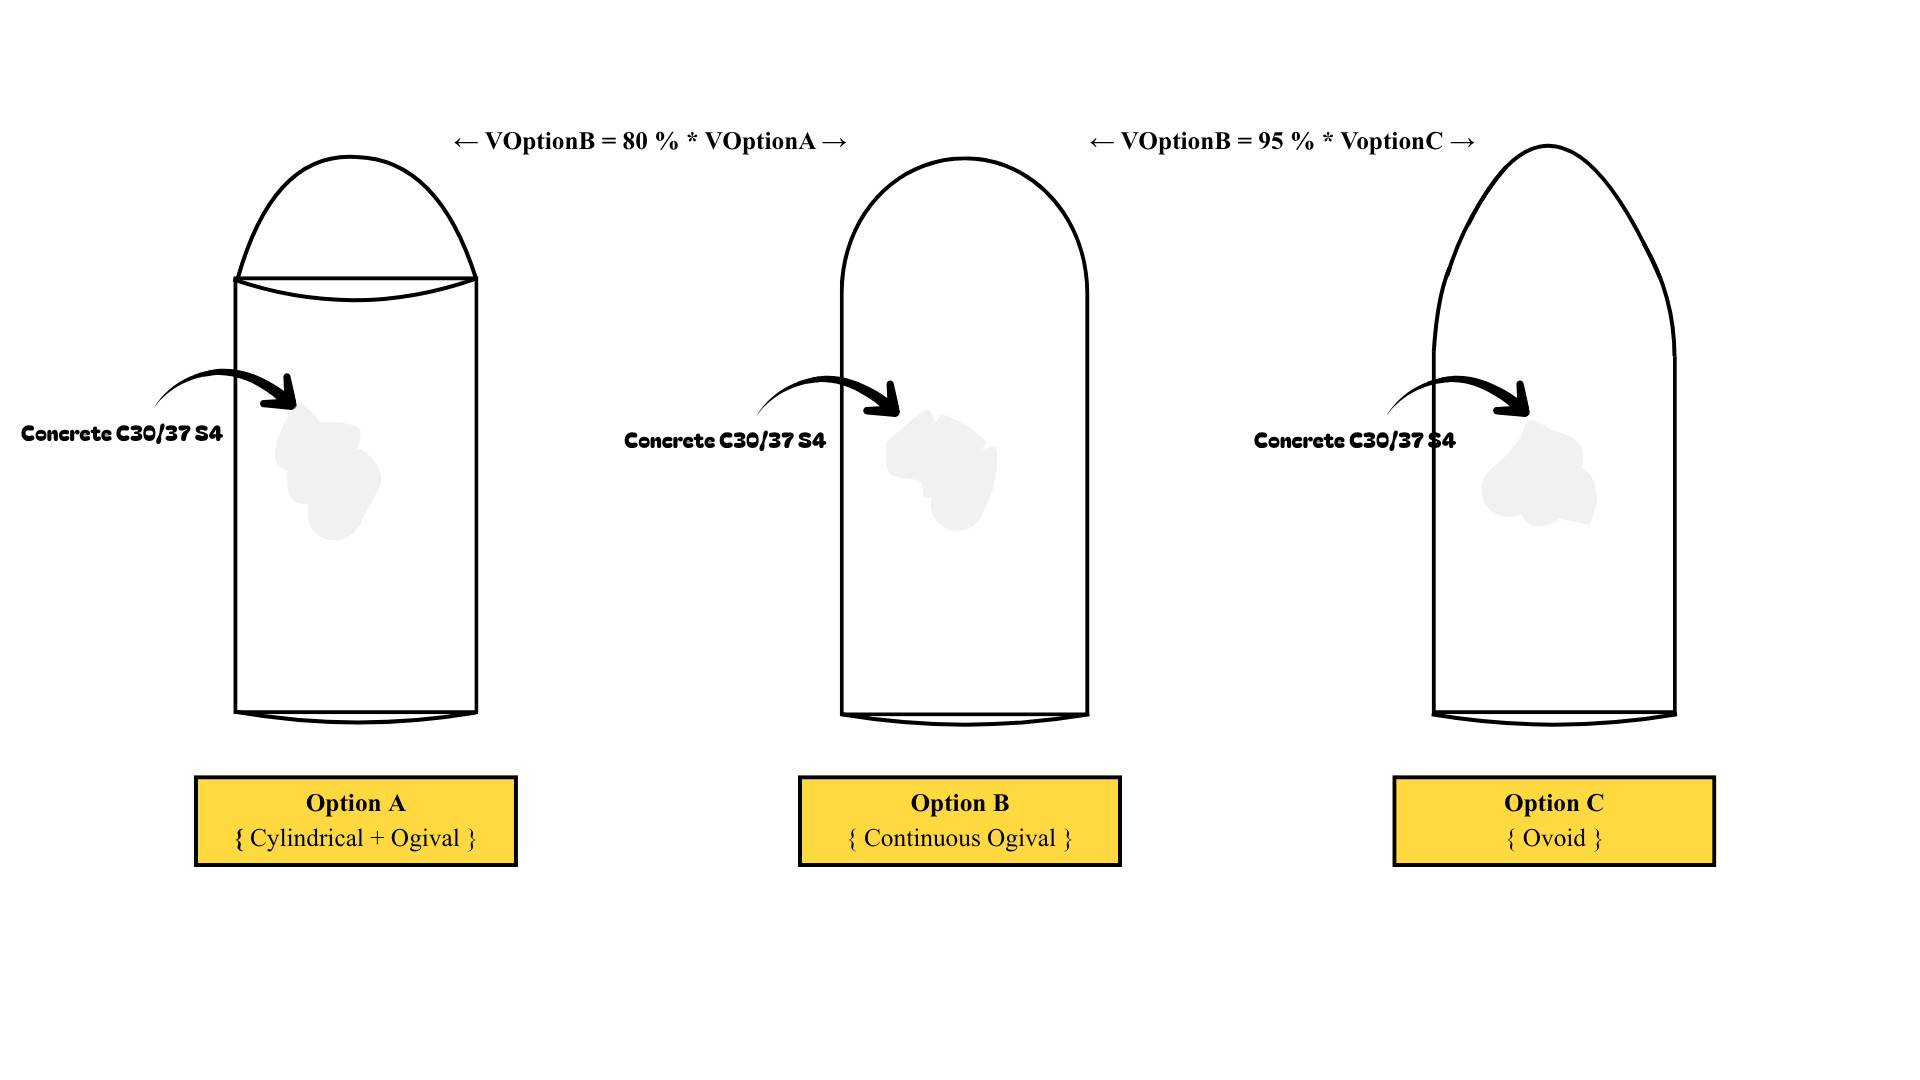
In practice, containment chambers can have different geometries. In this project, we have selected three representative configurations for comparison:
- Option A : Cylindrical + ogive
- The lower part consists of a vertical cylindrical shaft topped by a pointed arch. This configuration is found in particular in the French power plants at Fessenheim (1977), Tricastin (1980), and Bugey (1978).
- Option B : Continuous ogive
- The enclosure has a completely continuous shape, with no geometric breaks, from the base to the top. This type of design is used, for example, at Flamanville 3 (France), Olkiluoto 3 (Finland) and Taishan (China).
- Option C : Oval / Ovoid
- The enclosure also consists of a single continuous volume, but has a flatter, elliptical profile. This geometric design can be found in Kudankulam 1 & 2 (India), Tianwan 1–6 (China), and Balakovo (Russia).
The three designs are in the same material (concrete C30/37) and for simplicity’s sake, we assume:
V OptionB = 80 % * V OptionA = 95 % * V optionC
The volume ratios reflect the differences in compactness between the geometries: the continuous ogive shape (Option B) provides the most efficient envelope and therefore the smallest volume; the cylinder–ogive combination (Option A) results in an intermediate volume due to its greater effective height; and finally, the oval shape (Option C), which is more flattened, requires a slightly larger volume to maintain the same wall thickness and mechanical performance.
Interventions and Lifespan
Choice of life cycle duration
Technical literature on reinforced concrete containment structures is generally based on a reference service life of 40 to 60 years, corresponding to the nominal operating period before reassessment. For example, the International Atomic Energy Agency (IAEA) states that monitoring and maintenance programs are designed for a 50- to 60-year horizon, with the possibility of extensions subject to condition assessments [2]. Similarly, the Nuclear Regulatory Commission sets an initial license of 40 years, followed by typical renewals to reach 60 or even 80 years [3]. In practice, many facilities have effectively extended their operating life to 80 years through evaluation and structural renovation programs. A representative example is the Turkey Point plant (units 3 and 4, United States), which began operating in 1971-1972 and whose operating license has been extended until 2053, representing approximately 80 years of operation. This practice shows that nuclear infrastructure can be operated for significantly longer than its initial nominal lifespan, provided that appropriate monitoring and interventions are carried out.
In this study, we therefore use an analysis period of 120 years, corresponding to two 60-year cycles, in order to represent a complete life cycle of the enclosure, including: initial operation, aging, major interventions, and extension phase. This choice allows us to capture all significant maintenance and structural renovation events, which is consistent with actual aging management practices in the industry.
Life Cycle Inventory and Analysis
CO2 Emission
“The building and construction sector accounted for 37% of global CO₂ emissions related to energy and processes.”[6] It is therefore very important to take into account the emission of this greenhouse gas.
CO₂ emissions per kg of concrete depend mainly on the cement content of the concrete. However, the cement content of C30/37 concrete used for massive structures is approximately 335 kg/m³[7]. We can therefore conclude that our system emits 0.13 kg CO₂/kg of concrete.
NOx Emission
NOx gases have an indirect impact on the climate. They contribute to the formation of tropospheric ozone (O₃), which is a greenhouse gas. They also alter the chemistry of the atmosphere and contribute to acid rain.
NOx emissions are caused by the firing of clinker during concrete production. NOx emissions vary between 2.5 and 5g NOx/kg of cement[8]. We therefore choose the median value of 3.5g NOx/kg of cement. The NOx content in our concrete is therefore 1.17 kg NOx/m³ (=335×0.0035). Given that the density of concrete is 2400 kg/m³, we calculate 0.00048 kg NOx/kg concrete (=1.17/2400).
SO2 Emission
SO₂ is a major air pollutant that causes acid rain and is highly toxic to health. The formation of clinker releases SO₂ during concrete production. SO₂ emissions vary between 0.8 and 1.2 g SO₂/kg cement [9]. We have chosen the median value of 1.0 g SO₂/kg cement. The SO₂ content in our concrete is therefore 0.335 kg SO₂/m³ (= 335×0.001). Given that the density of concrete is 2400 kg/m³, we calculate 0.00015 kg SO₂/kg concrete (=0.37/2400).
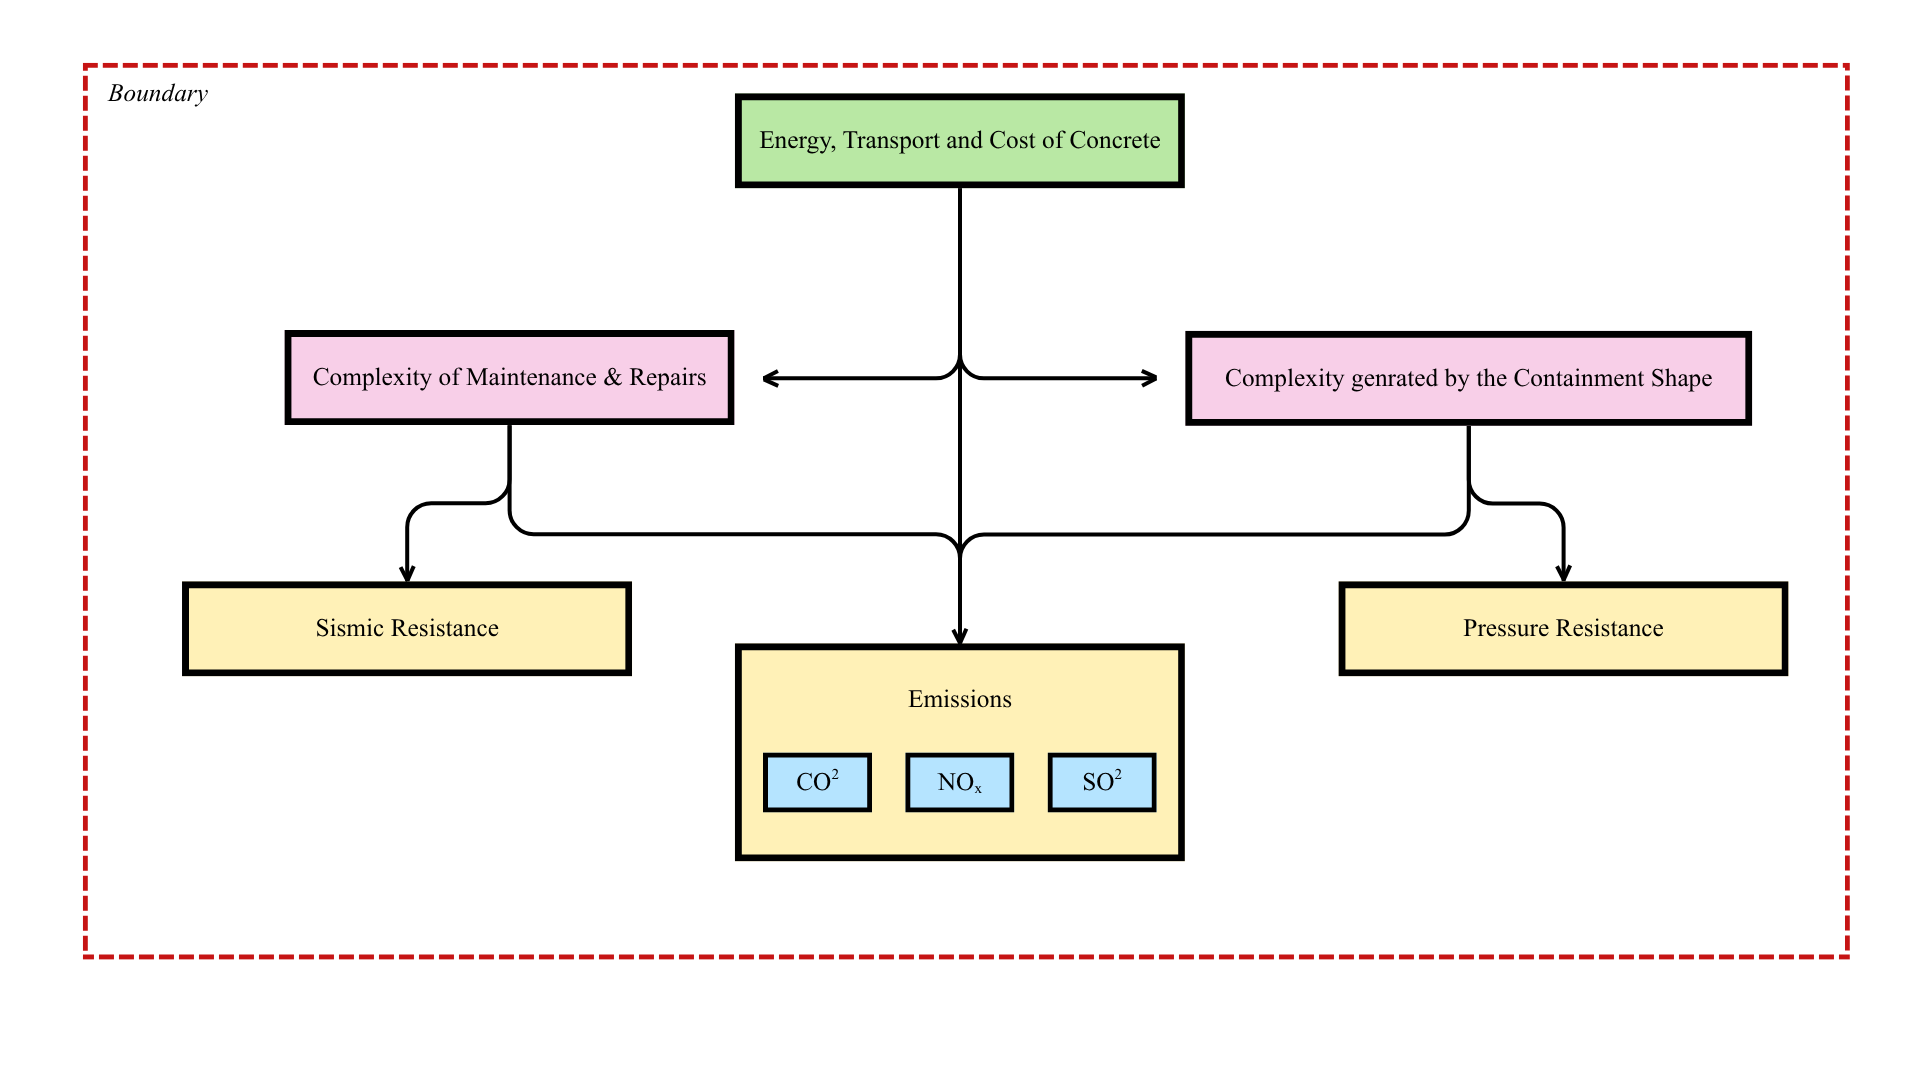
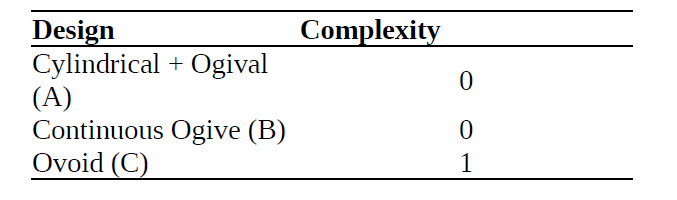
Complexity according to design
The ovoid shape is more difficult to construct: the formwork and reinforcement are more complex because the curvature varies continuously. In addition, the interior space is less practical to
organize: the walls slope earlier, which hinders the installation and handling of large equipment (tanks, steam generators, overhead cranes).
AHP Analysis
In this project, the AHP (Analytic Hierarchy Process) is used because the comparison of the three enclosure geometries—Cylindrical + Ogive, Continuous Ogive, and Ovoid—is based on multiple, heterogeneous, and sometimes contradictory criteria. Each option has different advantages: pressure resistance, seismic behavior, volume of concrete required, construction complexity, frequency of maintenance interventions, and environmental emissions associated with the material. It is impossible to determine the “best” solution based on a single indicator. AHP provides a mathematical framework capable of integrating all these dimensions into a coherent multidisciplinary decision.
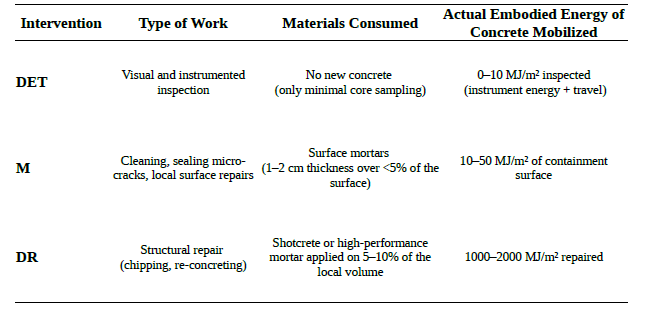
Frequency-based aggregation involves incorporating the effect of inspections, maintenance operations, and repeated repairs over the entire 120-year lifespan. The code first associates the life cycle inventory (LCI.values) with the intervention frequencies defined in the interventions table. Each LCI parameter (quantity of concrete, emissions, costs, complexity, etc.) is then multiplied by the number of times the corresponding intervention occurs. This gives the cumulative impact of each action over the entire life cycle. This step is essential: an option that is initially inexpensive may become unfavorable if it requires frequent or heavy interventions. The final table, Results, summarizes these total impacts for each option.
Once these values have been consolidated, AHP allows these indicators—which are expressed in incomparable units—to be converted into pairwise comparison matrices, according to Saaty’s scale. This enables a structured comparison between options, criterion by criterion. I then have the choice of defining the relative importance of each criterion in a dedicated matrix (for example, prioritizing pressure resistance or, conversely, CO₂ emissions).
In practice:
Once I have built the Results table, which groups together all the cumulative indicators for each option (A, B, C) over the life cycle, the rest of the code consists of preparing and then applying the AHP method to obtain a multi-criteria ranking of the design solutions.
I start by cleaning up the table to keep only the truly numerical columns, since these are the indicators that will be used in pairwise comparisons. Next, I extract the list of alternatives and criteria.
The first methodological step is the automatic construction of alternative-criterion comparison matrices. For each indicator, I use the values calculated in Results to generate a pairwise
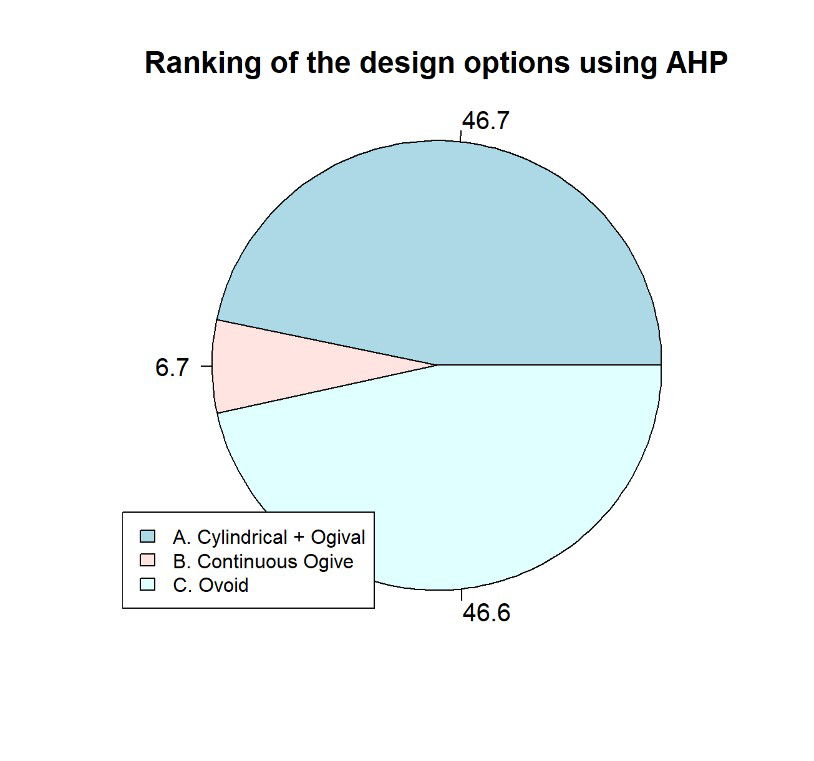
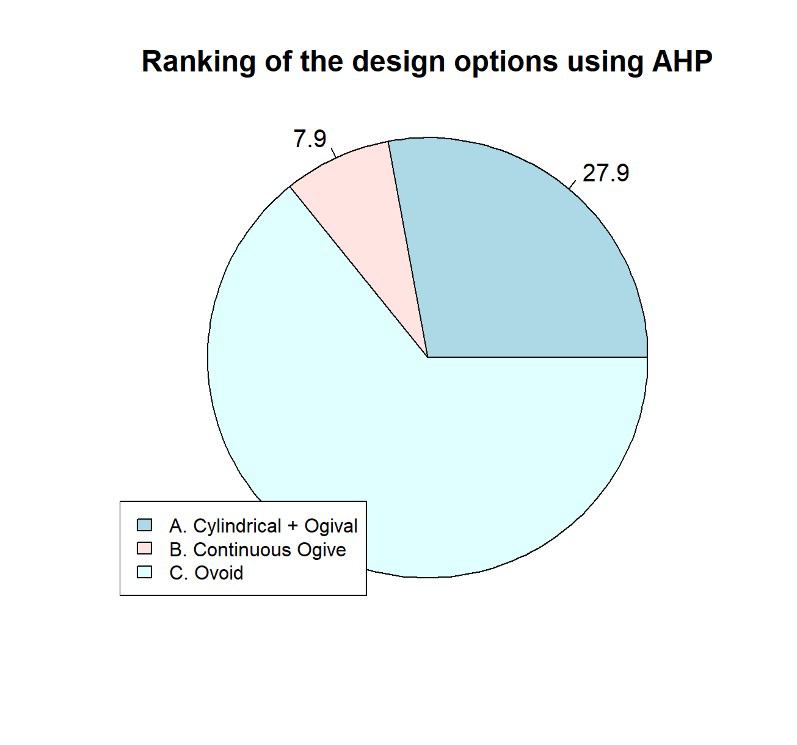
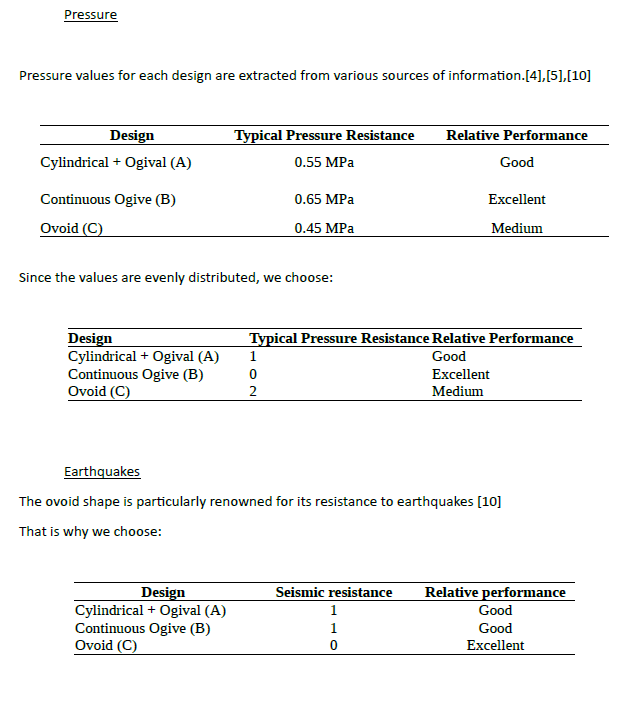
In our case, Option C should be chosen. Although it does not offer the highest resistance to internal pressure, its smooth ovoid geometry provides very good seismic performance thanks to its ability to dissipate lateral loads more efficiently than geometries with sharper curvature transitions. This makes it a robust solution in regions with significant seismic activity or less favorable soil conditions. However, it is also more expensive, as its geometry is more complex to construct and more difficult to integrate with large equipment. For this reason, it is generally used only in projects with specialized construction expertise, particularly in Russia, China, or India.
Main | Introduction | Integration Context | Maintenance Strategies | Life-Cycle Analysis | Multi-Objective Optimization | Conclusion