At this stage, the objective is to automate the search for maintenance strategies that minimize the total number of plant shutdown days over the 80-year service life. To do so, we first need to define the decision space, meaning the range of acceptable values for each maintenance interval.
In the previous test scenarios, the intervals were modified manually and quickly, without verifying whether the chosen values were technically realistic or acceptable from an operational point of view. While this approach was useful to understand general trends and sensitivities, it cannot be used for a rigorous optimization process.
We therefore establish bounded intervals for each type of maintenance action, based on feasibility and safety considerations. These bounds define the space of possible solutions and allow us to automatically explore a large number of consistent maintenance planning scenarios in a structured and systematic way.
In reliability-based maintenance planning, the maintenance intervals are not always deterministic values but are stochastic variables. This reflects the uncertainty in the deterioration process and inspection effectiveness. This uncertainty is commonly represented either implicitly through a reliability index or explicitly stated (Nowak and Collins, 2000; Melchers and Beck, 2018) In probabilistic service life design of concrete structures such as chloride ingress, corrosion initiation and cracking these exhibit significant variability and predicted times to reach limit states are therefore described using probability distributions rather than single values (Frangopol et al., 2004; van Noortwijk, 2009). In this context, the parameters that we will consider for the upper and lower bounds is the alpha, α, the relative deviation from the normal interval already mentioned in the previous tables.
Based on empirical data and probabilistic modeling of civil infrastructure deterioration, the deviation, α, is commonly on the order from 15 to 30% of the mean value (fib Bulletin 34, 2006; van Noortwijk, 2009). For safety of critical structures such as the nuclear containment plant as well as the other high-consequence infrastructure elements with aging management guidelines such as the tunnel that connects the whole system together, a conservative alpha was considered, 20% (IAEA SSG-48, 2018; NRC NUREG-2191, 2017). This represents a consistent percentage with both a conservative and probabilistic service-life design practice.
By systematically exploring different combinations of maintenance frequencies for the four systems, two performance indicators were selected to evaluate the strategies:
- The minimum interval between two non-simultaneous interventions, which is maximized as it reflects operational continuity between shutdowns; and
- The total cumulative number of maintenance days over the considered service life, which is minimized as it represents overall system downtime.
This dual objective is mathematically expressed through the preference function
p <- low(Total_days) * high(Min_interval)
Which favors solutions combining reduced downtime with longer uninterrupted operating periods.
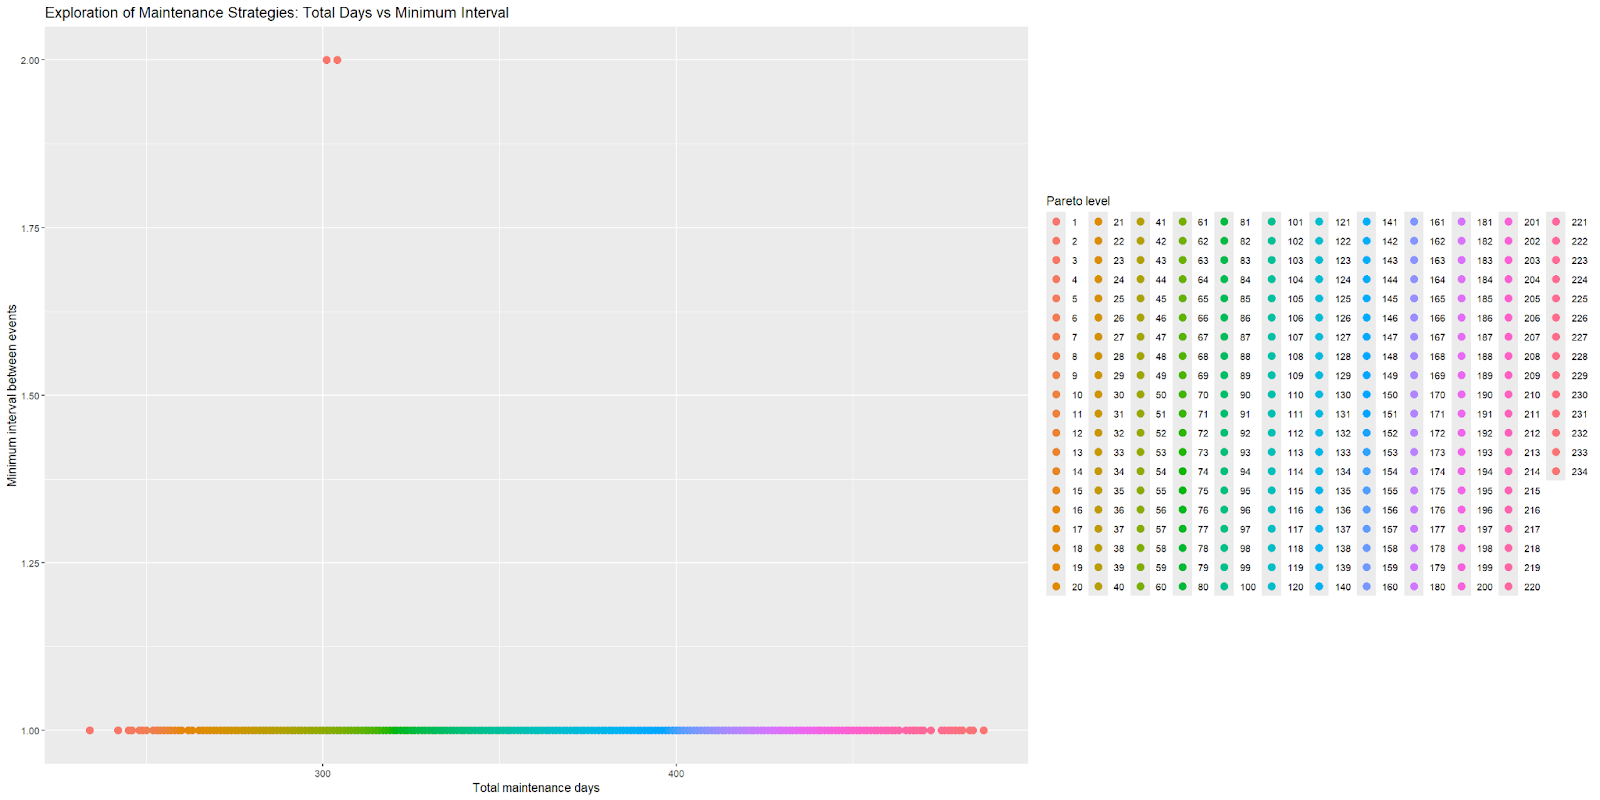
Each point in the plot therefore represents a distinct maintenance strategy. The x-axis shows the total interruption duration, while the y-axis indicates the minimum interval observed between two non-synchronized events. Colors represent Pareto levels, which correspond to relative performance tiers: the first level includes non-dominated solutions, while subsequent levels contain solutions dominated by at least one other strategy with respect to both criteria.
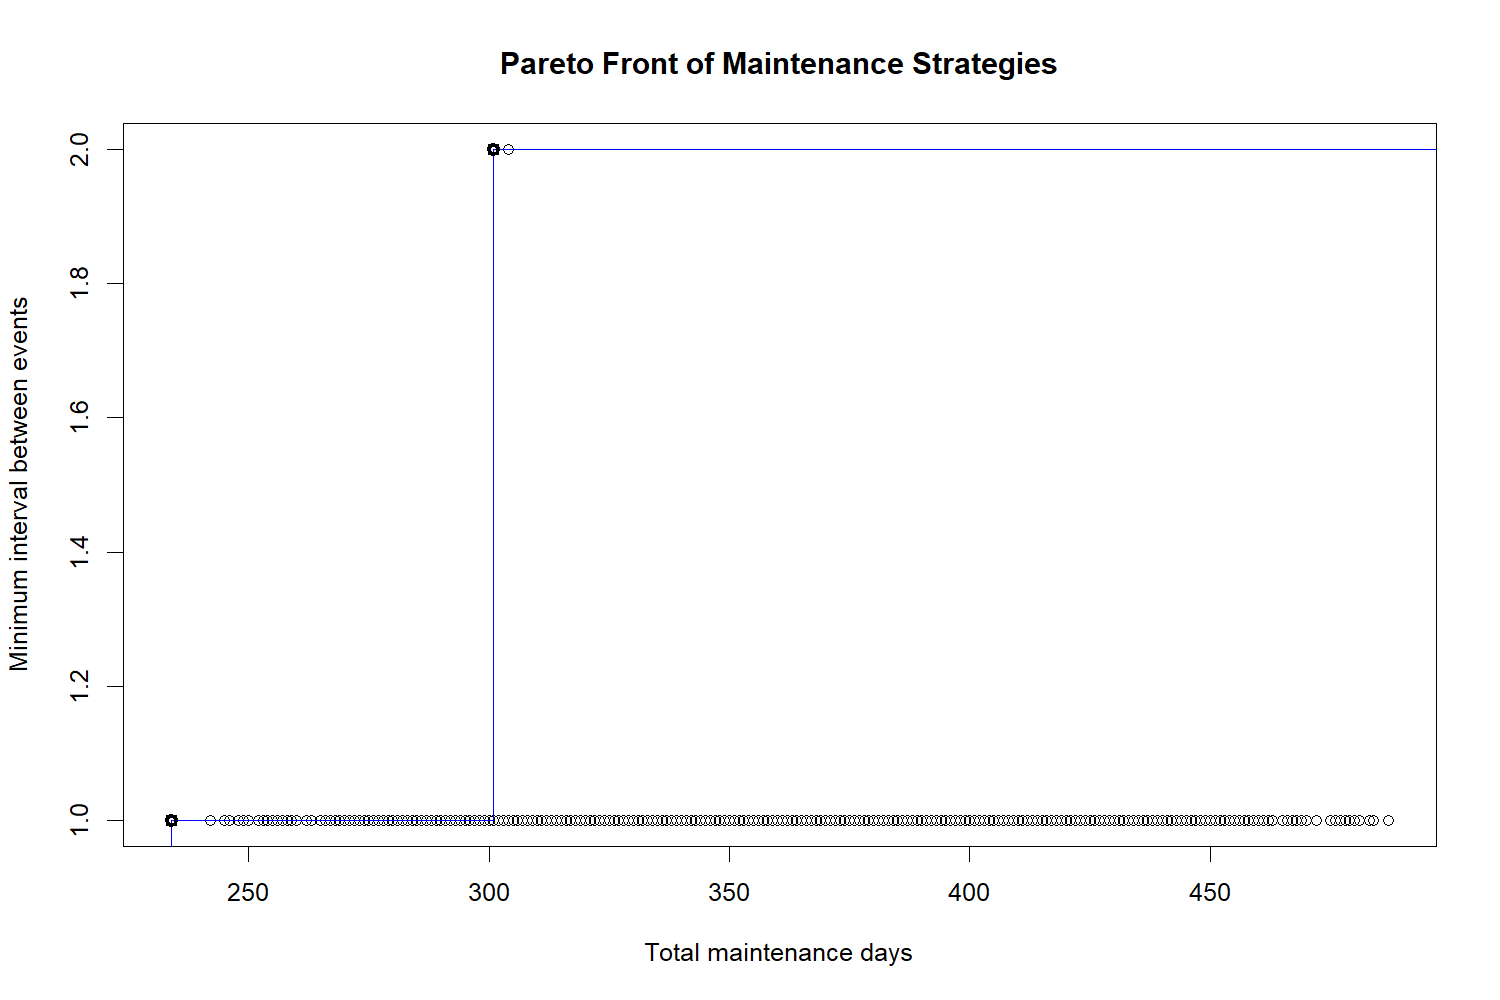
The Pareto frontier consists of strategies for which no improvement in one objective can be achieved without degrading the other. It therefore represents the set of optimal trade-offs between global availability and spacing of interruptions.
In this analysis, the Pareto frontier contains two level 1 points, with the following values:
| ID | VI.n | SR.n | DR.n | VI.s | SR.s | DR.s | VI.p | SR.p | DR.p | VI.t | SR.t | DR.t | Total Days | Min_interval | .level |
| 484 | 4 | 12 | 29 | 4 | 10 | 20 | 6 | 10 | 20 | 5 | 12 | 30 | 234 | 1 | 1 |
| 3341 | 4 | 14 | 28 | 2 | 8 | 20 | 4 | 12 | 20 | 4 | 10 | 26 | 301 | 2 | 1 |
These two level 1 points represent distinct optimal strategies, and choosing between them ultimately depends on the priorities set by the Swiss nuclear authorities. In other words, one cannot improve one of the criteria without deteriorating the other, so a decision must be made regarding what is considered the most constraining factor: minimizing the total number of maintenance days (234 vs. 301, corresponding to 3.3% difference per year over 80 years) or maximizing the minimum interval between non-simultaneous interventions (1 vs. 2 years).
It is important to note that while the total maintenance days differ by only 67 days over 80 years (0.84 days per year on average), the distribution and frequency of interventions vary substantially.
For example, the most pronounced change is observed in DR.t, where the interval between major repairs decreases from 30 to 26 years, representing a reduction of approximately 13%. This adjustment implies that major tunnel repairs would occur more frequently in one strategy compared to the other, potentially increasing material consumption, labor requirements, and environmental impacts for this subsystem. Similarly, VI.s inspections are halved from 4 to 2 years, which significantly alters the monitoring schedule and may affect the early detection of minor damages. These differences illustrate that even small changes in global downtime can hide substantial variations in the individual maintenance activities, which may have very different economic and environmental impacts.
Furthermore, if we also examine level 2 points with a minimum interval similar to that of level 1 (Min_interval = 1 year), it becomes evident that even for nearly identical spacing between non-simultaneous interventions, the total number of maintenance days can remain relatively close, while the specific intervention frequencies and affected systems diverge significantly.
| ID | VI.n | SR.n | DR.n | VI.s | SR.s | DR.s | VI.p | SR.p | DR.p | VI.t | SR.t | DR.t | Total_days | Min_interval | .level |
| 395 | 3 | 12 | 20 | 3 | 10 | 16 | 6 | 12 | 24 | 6 | 10 | 20 | 242 | 1 | 2 |
| 484 | 4 | 12 | 29 | 4 | 10 | 20 | 6 | 10 | 20 | 5 | 12 | 30 | 234 | 1 | 1 |
The most notable changes occur for VI.n, which decreases from 4 to 3 years (25% reduction), and DR.t, which decreases from 30 to 20 years (33% reduction), indicating substantially more frequent major repairs in these subsystems. Despite these substantial differences in individual maintenance actions, the total maintenance days differ by only 8 days over 80 years (approximately 0.1 days per year on average), illustrating that similar global downtime can mask significant variations in resource use and subsystem-specific impacts.
This reinforces the need to consider full lifecycle assessment (LCA), including both environmental impacts and costs, in order to select a strategy that balances operational availability with sustainability and economic performance. At this stage, the objective is therefore no longer only to minimize shutdown duration, but to identify maintenance strategies that balance operational availability with economic and environmental performance.
Main | Introduction | Integration Context | Maintenance Strategies | Life-Cycle Analysis | Multi-Objective Optimization | Conclusion