The duration–spacing diagram provides a direct view of how integrated maintenance decisions influence system behavior under the material-logistics-based strategy. Each point in the figure represents a feasible organization of maintenance actions that respects the predefined intervention types, admissible year ranges, and activity durations. Rather than focusing on individual subsystems, the figure highlights how these decisions interact once all subsystems are maintained within a shared system context. For Strategy 3, 125 scenarios were generated as shown in the figure below.
The first observation from the figure 3.b is the clear separation of solutions into distinct horizontal bands. This indicates that, at system level, only a limited number of minimum spacing regimes naturally emerge once maintenance actions are combined. The presence of these bands reflects structural constraints imposed by recurring interventions—particularly surface repairs—that occur across several subsystems. Even when intervention timing is adjusted to improve coordination, these recurring activities restrict how far maintenance events can be separated in time.
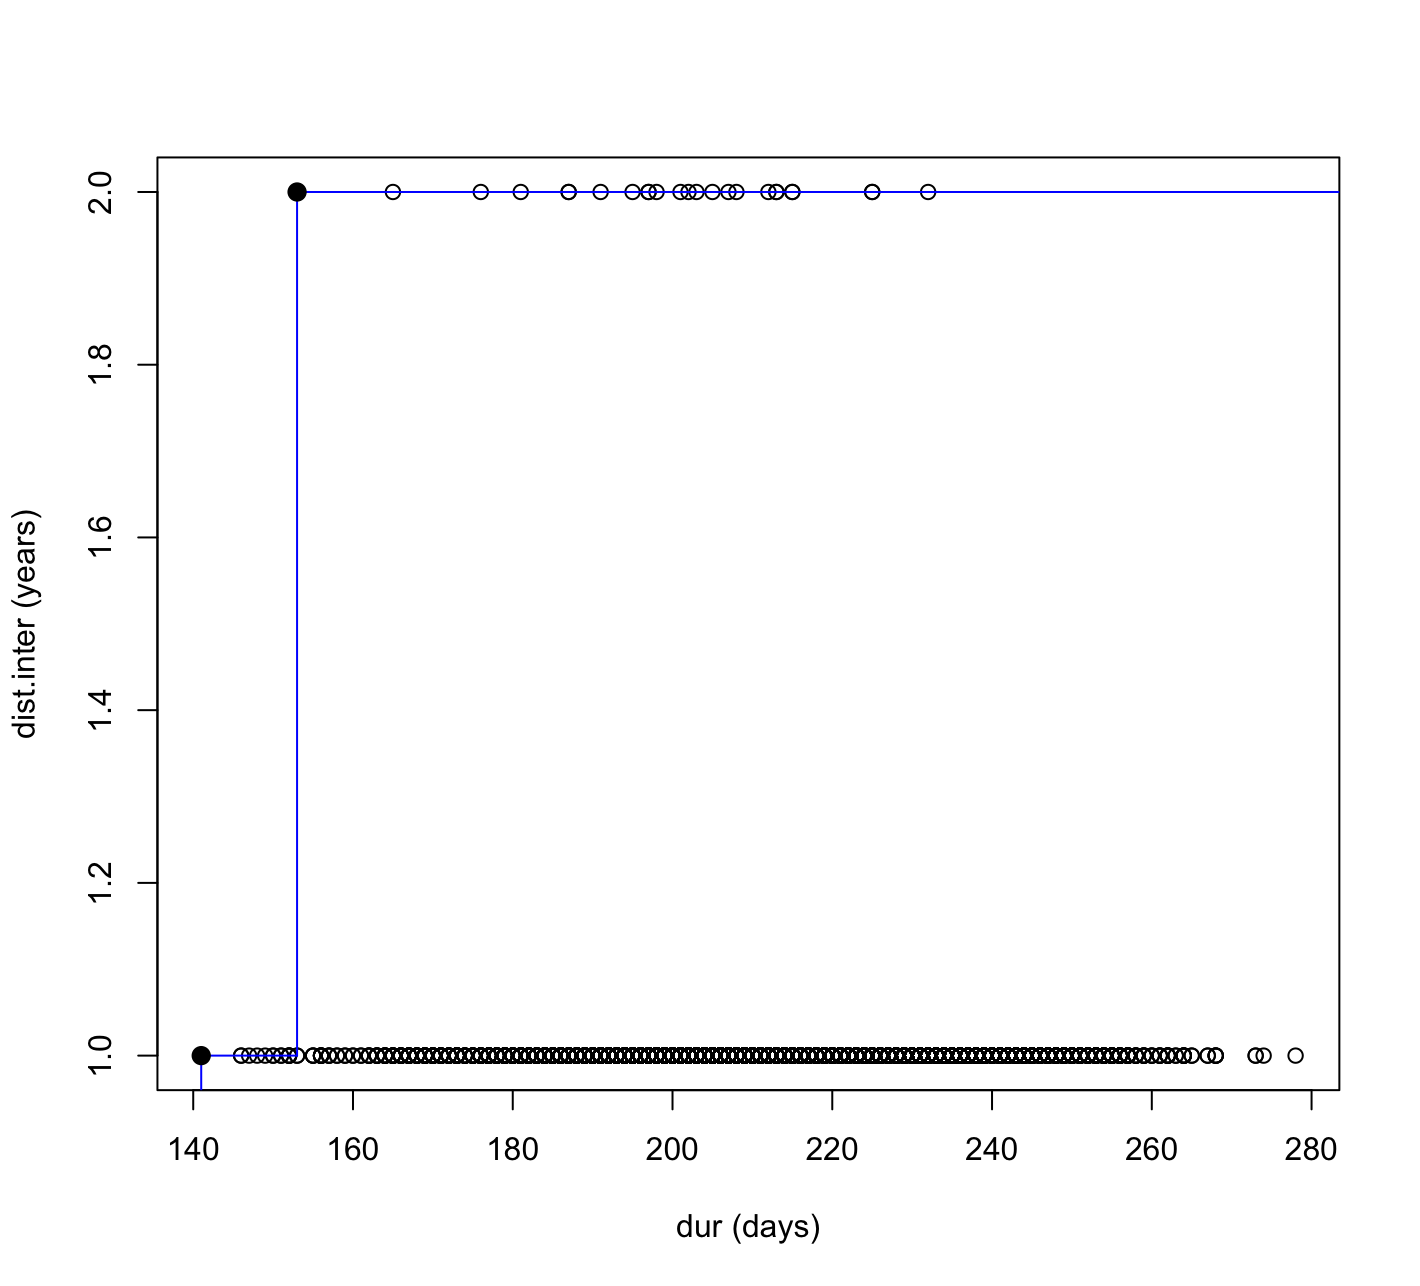
The lower region of the plot corresponds to solutions where maintenance actions are closely grouped. In these configurations, the system experiences shorter cumulative service interruption because material intensive activities are deliberately aligned and executed within shared time windows. This outcome is consistent with the core logic of Strategy 3: by coordinating interventions that require similar materials, repeated mobilization and delivery cycles are reduced, which in turn limits the total number of disruption days. However, this improvement is achieved at the cost of reduced spacing between events, resulting in a more compact maintenance timeline.
As spacing increases, the figure shows a gradual shift toward higher interruption durations. This trend reflects the reduced ability to combine maintenance actions when temporal separation is enforced. Once interventions are pushed further apart, opportunities for shared material logistics diminish, and maintenance activities increasingly occur as standalone events. While this leads to longer recovery periods between interventions, it also increases the total number of days during which the system is affected.
Importantly, the figure highlights a range of viable configurations that balance interruption duration and spacing in different ways. This behavior suggests that the system does not benefit from enforcing a fixed minimum interval between maintenance events. Rather, performance depends on how effectively interventions are clustered when material requirements overlap, and how selectively spacing is increased when coordination benefits are limited.
From a system-planning perspective, this outcome reinforces the role of Strategy 3 as a coordination oriented approach rather than a timing-driven one. The optimization does not seek to maximize spacing or minimize downtime independently, but to explore how logistical alignment reshapes the trade-off between the two. The resulting solution space therefore offers planners flexibility: solutions can be chosen that favor reduced disruption through tight coordination, or increased temporal separation where operational constraints require it, without violating the underlying maintenance assumptions.
This output summarizes a selected optimal integrated maintenance solution identified for Strategy 3. The total system interruption over the service life amounts to 257 days, representing the cumulative duration during which maintenance activities affect system availability when all subsystems are considered together. This result reflects the effect of coordinating material-intensive interventions within shared time windows, which limits repeated execution phases and reduces overall disruption.
The listed intervention timings indicate representative maintenance events occurring at day 1071 and day 1501. For this solution, the minimum spacing between maintenance interventions ranges between 1 and 2 years, with a system-level minimum spacing of 1 year. This indicates that while some activities can be separated by longer intervals, at least one pair of interventions occurs within a one-year window, defining the limiting spacing for the system. Overall, this configuration represents a feasible optimum that balances reduced total interruption with compact temporal organization, consistent with the objectives of the material-logistics-based maintenance strategy.
Overall, the results demonstrate that material-based integration has a tangible influence on system performance. By shifting the focus from isolated subsystem schedules to shared logistical windows, Strategy 3 produces a structured yet flexible solution space that captures realistic compromises between service interruption and maintenance spacing at the system level.
LCA & Multi-Objective Analysis >>
Home | System Definition | Scenario 1 | Scenario 2 | Scenario 3 | Scenario 4 | Discussion | Appendix