To address the previously defined multi-objective optimization problem, a NSGA-II (Non-Dominated Sorting Genetic Algorithm II) genetic algorithm was employed. This method is particularly well-suited for complex systems with conflicting objectives and a large decision space, which accurately represents the case at hand, combining integrated maintenance planning and life-cycle analysis.
The optimization was performed over a decision space of 16 variables, including:
- 12 maintenance intervals, corresponding to VI, SR, and DR interventions for each of the four systems studied;
- 4 design parameters, representing the reinforced concrete thicknesses of the parking structure, tunnel, pedestrian passage, and nuclear containment building.
Seven objectives were considered to capture both operational, environmental, and economic performance of the integrated system:
- Minimization of total system downtime due to maintenance interventions, expressed as cumulative days over 80 years (Total_days);
- Maximization of the minimum interval between non-simultaneous interventions (Min_distance);
- Minimization of cumulative environmental impacts, including energy consumption (MJ), CO₂, NOx, and SO₂ emissions (kg);
- Minimization of the total life-cycle cost, expressed in billions of Swiss francs (GCHF).
The NSGA-II algorithm was run for 50 generations, with a population of 400 individuals, providing a robust compromise between convergence, solution diversity, and computational time. The resulting set of non-dominated solutions forms the Pareto front, representing the best possible trade-offs among the conflicting objectives.
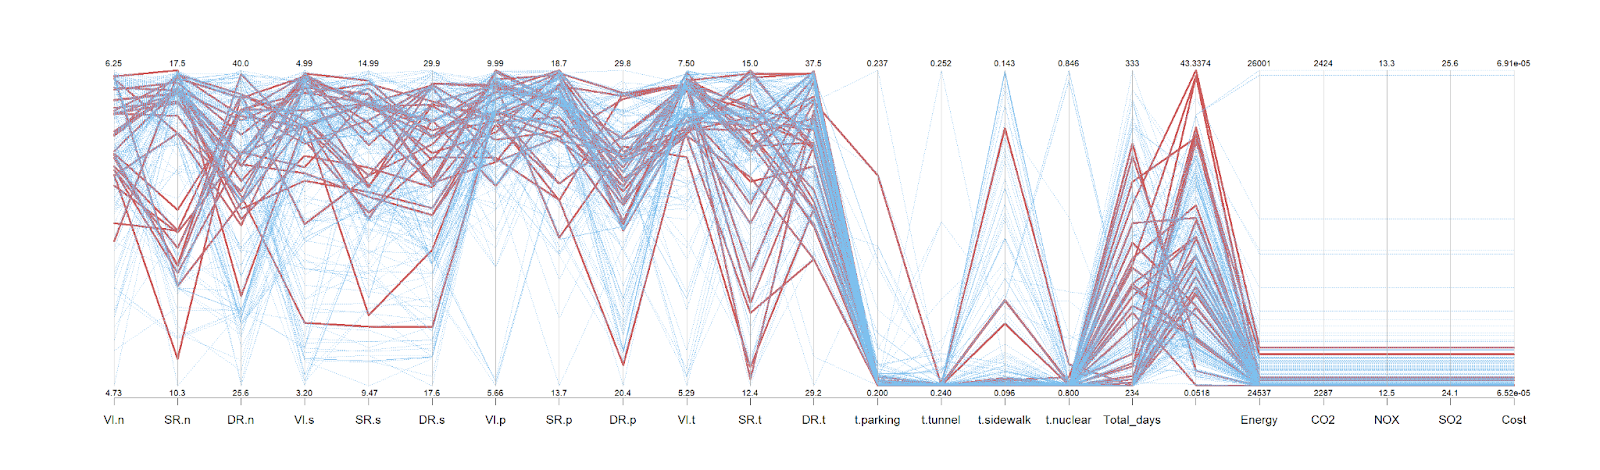
The analysis is visualized using a parallel coordinates plot, which simultaneously displays all decision variables and performance indicators. Each line corresponds to a candidate solution, while the vertical axes represent:
- optimized maintenance intervals,
- structural thickness parameters,
- performance indicators (downtime, environmental impacts, and cost).
Pareto-optimal solutions are highlighted in red, whereas dominated solutions are shown in blue. This visualization allows for an intuitive understanding of correlations between design parameters, maintenance strategies, and overall system performance, as well as the trade-offs imposed by the optimization.
Quantitative Analysis of Pareto Solutions
The analysis of non-dominated solutions reveals relatively narrow variation ranges for several key variables.
Maintenance Intervals
For the nuclear containment building, optimal intervals are concentrated around:
- VI.n: 5.4 to 6.2 years
- SR.n: 10.9 to 17.5 years
- DR.n: 29.7 to 39.8 years
This limited dispersion (≈10%) indicates that the nuclear system acts as a Pareto bottleneck, imposing relatively fixed intervention frequencies to maintain optimal performance.
Other systems exhibit slightly higher variability while remaining structured:
- Tunnel: DR.t 32.5 to 37.5 years
- Parking: DR.p 20.9 to 29.1 years
- Pedestrian passage: DR.s 19.9 to 29.4 years
Pareto solutions therefore favor long renewal cycles combined with relatively frequent inspections, consistent with heavy preventive maintenance strategies.
Design Parameters (Thicknesses)
Concrete thicknesses associated with Pareto solutions are remarkably stable:
- Nuclear containment: =0.80 m (standard deviation = 0.00115)
- Tunnel: = 0.24 m (standard deviation = 0.00096)
- Parking: = 0.20 m (standard deviation = 0.00588)
- Pedestrian passage: = 0.096 m (standard deviation = 0.00751)
This stability indicates that structural design is not a major lever in the optimization, with Pareto trade-offs primarily achieved through intervention scheduling rather than structural oversizing.
Environmental Impacts and Cost
Environmental impacts vary minimally along the Pareto front:
- Cumulative energy: 24,537 to 24,576 MJ (+0.15 %)
- CO₂: 2,287 to 2,301 kg (+0.6 %)
Similarly, the total life-cycle cost is extremely constrained:
Cost ∈ [6.52 × 10⁻⁵ ; 6.57 × 10⁻⁵] GCHF,
corresponding to a variation of less than 0.8 % between Pareto solutions.
These results confirm that performance differences among solutions are essentially operational, rather than economic or environmental.
The Swiss Federal Nuclear Safety Inspectorate places particular emphasis on:
- Life-cycle cost as a long-term sustainability indicator,
- Total system downtime, which directly impacts operations, crew planning, and overall site safety.
Accordingly, a dedicated graph showing the Pareto front between cost and total downtime was extracted for a more detailed analysis of this key trade-off.
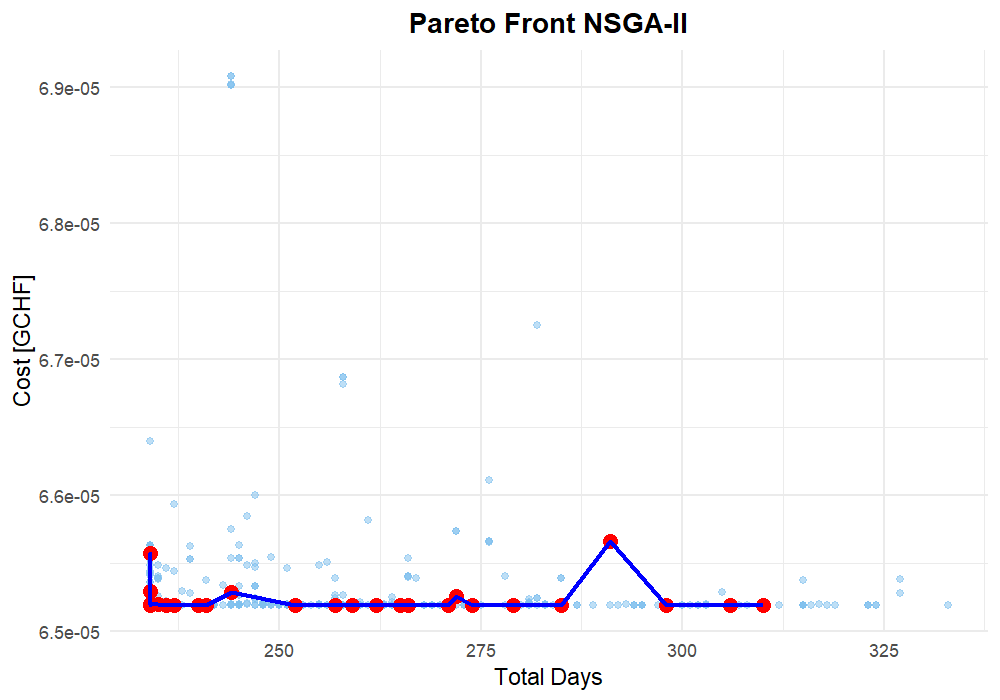
The Pareto front shows that total downtime varies significantly, from 234 to 291 days over 80 years, while cost remains nearly constant.
Numerical Observations
- The highest availability solutions achieve 234 days of downtime at a cost of 6.519–6.520 × 10⁻⁵ GCHF.
- Increasing downtime by almost +75 days provides no significant cost reduction.
- Slightly higher-cost solutions (6.56 × 10⁻⁵ GCHF) correspond to strategies with shorter DR intervals, resulting in more frequent distinct shutdowns.
Hence, the maximum availability gain is 15.4 %, while the cost variation is below 1 %, negligible at the life-cycle scale.
Operational Interpretation
These results clearly indicate that:
- Cost is not the primary discriminating factor along the Pareto front,
- The true performance lever is the synchronization of interventions across systems.
From a decision-making perspective, it is therefore rational to prioritize solutions at the leftmost edge of the front (near 234 days), as they provide:
- higher overall availability,
- simpler shutdown planning,
- without measurable economic penalty.
Implications
Operationally, these results have major implications. The near-constant life-cycle cost along the Pareto front implies that system availability becomes the decisive criterion for maintenance strategy selection rather than cost.
In a nuclear plant context, where continuous operation, crew management, and precise scheduling of shutdowns are critical, a strategy targeting around 234 days of downtime is highly relevant. This approach allows for:
- minimizing interruptions to site access,
- improving responsiveness in unforeseen events,
- without significant life-cycle cost increase.
In practice, this suggests that intentionally grouping maintenance interventions, even at the expense of slightly shorter intervals or a higher number of interventions, constitutes a more robust and realistic strategy for an integrated nuclear system than simply maximizing individual maintenance intervals.
Conclusion
This study demonstrates that coordination, not system optimization, is what drives maintenance performance in nuclear facilities. Over the course of the service life, unneeded shutdowns result from planning maintenance for each system separately. The impact of altering individual maintenance intervals is minimal. Only when interventions are time-aligned can downtime be significantly reduced. Even when the overall number of interventions rises, grouping maintenance tasks lowers the number of shutdowns.
This is confirmed at the system level by the optimization. While life cycle costs and environmental effects are nearly constant, total downtime varies greatly amongst optimal solutions. As a result, availability can be increased without incurring any associated financial or environmental costs. The nuclear containment structure serves as a restraint and essentially sets the system’s maintenance schedule. Enough flexibility is provided by other components to allow for synchronization. Scheduling decisions are more important than structural thickness. Downtime becomes the deciding factor when cost is almost constant. Strategies with shorter shutdown times provide easier operation and increased availability without increasing life cycle costs.
Main | Introduction | Integration Context | Maintenance Strategies | Life-Cycle Analysis | Multi-Objective Optimization | Conclusion