1 Introduction
The tower of an offshore wind turbine (OWT) is a typical slender, variable-cross-section steel structure, whose geometry is determined by multiple parameters, including tower height, bottom and top diameters, wall thickness, number of segments, and flange specifications. These geometric variables not only directly affect the overall stiffness, mass distribution, and structural stability of the tower but also influence manufacturing costs, transport feasibility, and offshore installation complexity. Therefore, systematically controlling these geometric features through parametric modeling is a key technical approach to support early-stage design decisions for OWT towers.
The core design challenge addressed in this study is how to minimize the tower’s self-weight while maintaining sufficient overall stiffness and stability to satisfy the offshore operational requirements for structural dynamic performance and buckling resistance. A lighter tower helps reduce material costs, lower manufacturing energy consumption, and improve transport efficiency; however, reducing diameter or wall thickness increases structural flexibility, raises the overall slenderness ratio, and may lead to decreased buckling capacity, increased tower-top displacement, and enhanced wind-induced vibrations.
Based on the above trade-offs, this study selects tower segment mass and overall tower slenderness ratio as two key performance indicators: the former representing economic efficiency and the latter reflecting structural safety. By generating different design alternatives using a parametric model and quantifying these two indicators, the study provides a basis for informed tower design decisions.
2 Parametric Model Description
2.1 Input Parameters
In this study, a parametric geometric model of an OWT tower was developed based on Dynamo. In accordance with the design standard GB/T 31517–2015[1], several geometric and structural parameters were selected as model inputs, as summarized in Table 1. All geometric features are automatically updated with changes in these parameters, enabling rapid generation of different design alternatives. The selected parameter ranges ensure that the model maintains sufficient design flexibility for exploration while remaining within practical engineering limits. Although this study focuses primarily on mass and slenderness ratio, the model is generalizable and can be further applied to evaluate other performance criteria.
Table 1 Design Parameter
| Parameter | Range | Step |
| Tower Height | 80-120m | 5m |
| Bottom Diameter | 4-8m | 0.1m |
| Top Diameter | 3-6m | 0.1m |
| Wall Thickness | 0.05-0.1m | 0.1m |
| Segments Count | 3-8(integer) | 1 |
| Foundation Diameter | 10-15m | 0.1m |
| Foundation Height | 10-15m | 0.1m |
| Height at the base of the variable cross-section | 0.4*Foundation Height | —— |
| Flange Thickness | 0.02-0.08m | 0.01m |
| Bolt Hole Diameter | 0.02-0.04m | 0.01m |
| Boly Spacing | 3.5*Bolt Hole Diameter | —— |
| Flange Ring Width | Wall Thickness+12*Bolt Hole Diameter | —— |
2.2 Model Logic
The core concept of the Dynamo model is to use the tower centerline as the primary control geometry, achieving a fully parameterized generation of the tower and foundation system through segmentation, cross-section control, and flange construction. The model maintains a high degree of parameterization and geometric correlation, facilitating the rapid generation of numerous design alternatives. The parametric model and some details are shown in Fig. 1-3, and the overall workflow is as follows:
1 Establishing the tower centerline. The upper half of the tower centerline is generated based on the input tower height, serving as the reference axis for subsequent circular geometries of the tower.
2 Segment division and plane creation. According to the number of tower segments, the centerline is divided either evenly or parametrically. At each segment position, a corresponding plane is generated to define cross-sectional diameters, wall thickness variations, and flange installation locations.3 Determining foundation centerline and variable cross-section positions. To construct the foundation, the tower centerline is extended downward to generate the foundation axis. Meanwhile, the transition positions between the tower and foundation variable cross-sections are determined based on input parameters.
4 Flange upper and lower plane positioning. At each segment plane, the plane is shifted along the centerline direction by half the flange thickness both upward and downward, defining the upper and lower surfaces of the flange.
5 Geometry tower variable cross-section solids. Using the upper half-tower centerline, along with the bottom and top diameters, a variable-section tower solid is generated.
6 Geometry foundation solids. Under the foundation centerline, the foundation solid is generated based on the tower bottom diameter, foundation diameter, and positions of the transition-variable cross-sections.
7 Flange solid modeling. Two circles (inner and outer edges) are derived from the intersection of the tower outer wall and the lower flange plane. Each circle is offset outward and inward by six bolt diameters to satisfy installation space requirements. The offset circles are then used to define the flange’s inner and outer surfaces, generating the complete flange solid.
8 Bolt Hole Generation. To create bolt holes, the circles from the flange-tower intersection are offset inward and outward by three bolt diameters. The number of bolts that can be arranged along the circle is automatically calculated based on the bolt spacing parameter. Bolt centers are then positioned along the offset circles, and corresponding solids are generated according to the bolt diameter.
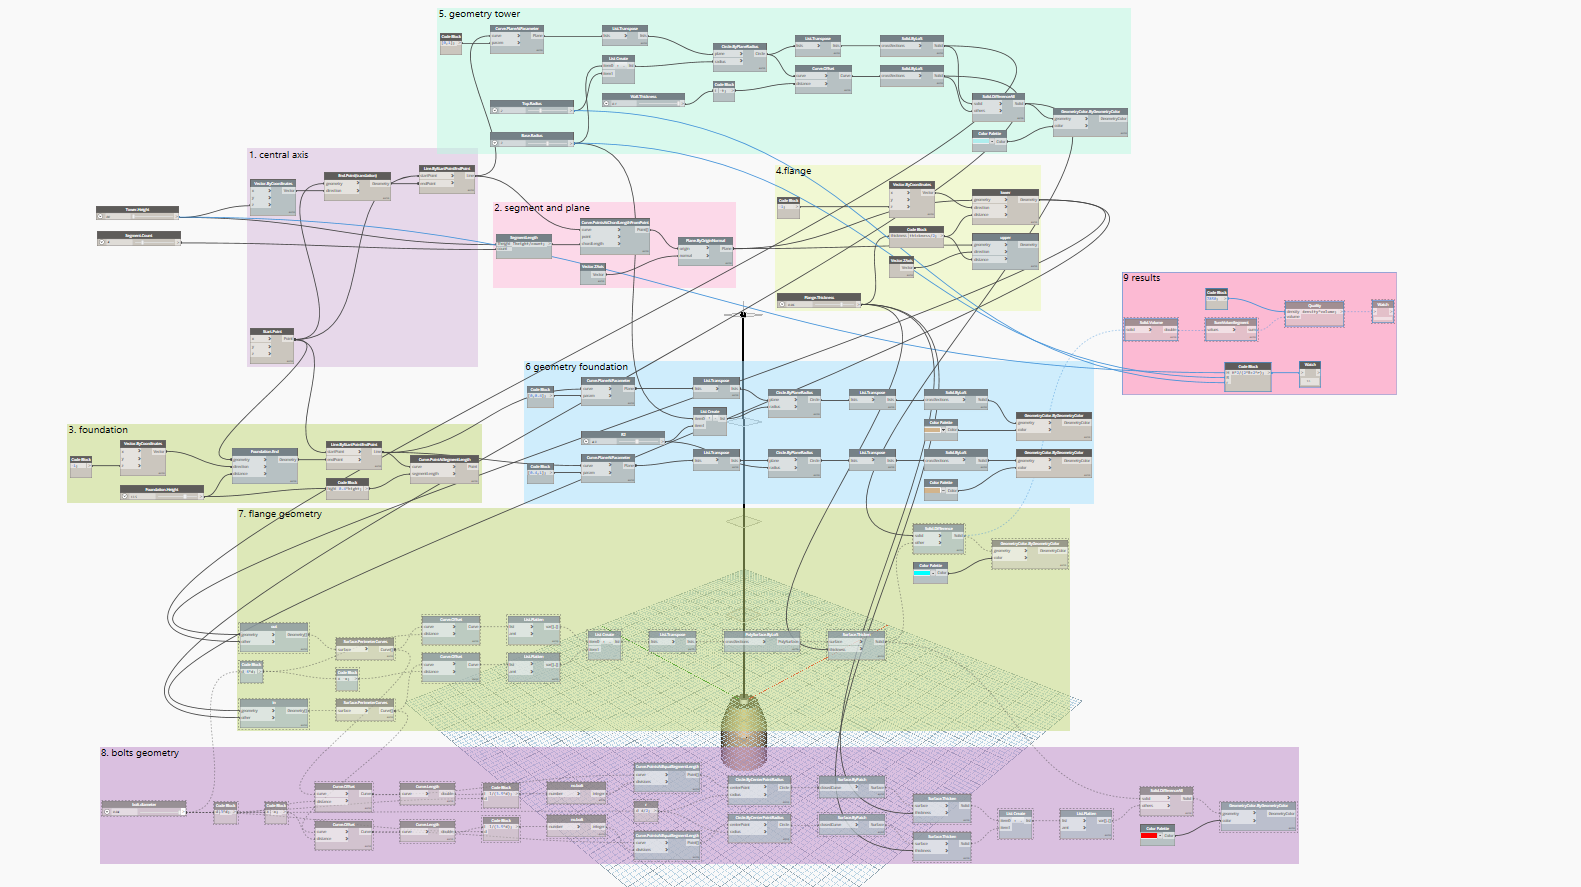
Fig: 1
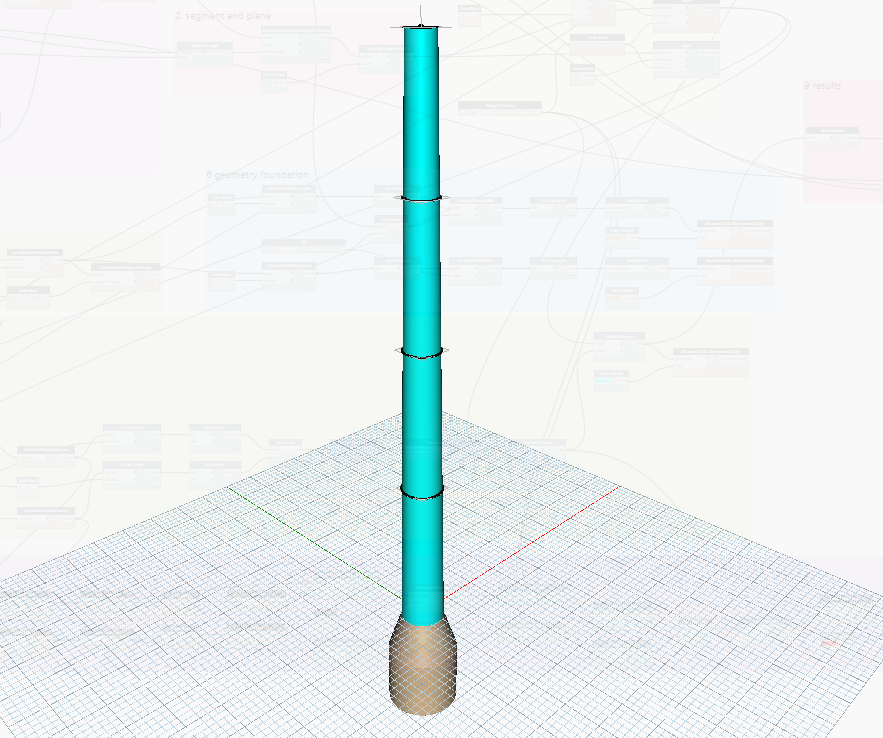
Fig: 2

Fig: 3
3 Engineering Rationale
To evaluate the design performance of OWT towers, this study selects tower segment mass and overall tower slenderness ratio as two key performance indicators, representing economic efficiency and structural performance, respectively.
3.1 Tower Segment Mass
The mass of a tower segment directly reflects the structure’s self-weight and material consumption. OWT towers are typically fabricated from high-strength steel, with material costs accounting for 25%–35% of the total project expenditure [2]. Reducing tower segment mass can significantly lower material costs while also simplifying transportation, assembly, and installation, thereby improving construction efficiency. However, a reduction in tower mass is often accompanied by decreased wall thickness or diameter, which may result in (a) increased structural flexibility and larger tower-top displacements; (b) reduced overall buckling capacity; (c) decreased first-order natural frequency, potentially leading to resonance with blade excitation. Therefore, tower mass must be carefully balanced against structural stiffness from an engineering perspective.
The mass of a tower segment can be directly calculated using geometric parameters and material density:
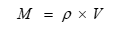
The parametric model can output real-time mass variations, enabling designers to establish a clear correlation between geometric modifications and material consumption.
3.2 Tower Slenderness Ratio
The slenderness ratio is a critical indicator of tower stability and buckling capacity. A high slenderness ratio () typically indicates (a) insufficient stiffness, resulting in excessive tower-top displacements; (b) reduced buckling capacity; (c) increased sensitivity to wind-induced dynamic responses.
Thus, the slenderness ratio, together with tower segment mass, reflects the trade-off between economic efficiency and structural safety.
Since the tower is a variable-cross-section structure, this study adopts the commonly used average diameter method for equivalent treatment:
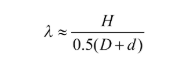
Where, H is the tower height and D and d are the bottom and top diameters, respectively. This approach is widely used in early-stage engineering design, allowing for a rapid assessment of tower flexibility and buckling characteristics.
4 Design Space Exploration
4.1 Design Alternatives
Based on the defined parameter ranges, nine representative design alternatives were generated. These include designs with minimal material usage, designs with relatively balanced material stiffness, and designs biased towards structural rigidity. This selection enables a balanced evaluation of economic efficiency versus structural safety, as summarized in Table 2. A scatter plot of tower segment mass versus slenderness ratio is presented in Fig.1.
Table 2 Different Alternatives
| Alternatives | Tower Height | Segments Count | Bottom Diameter | Top Diameter | Wall Thickness | Mass(kg) | |
| A | 80 | 4 | 6.0 | 4.0 | 0.10 | 3864170 | 16 |
| B | 85 | 4 | 5.8 | 3.8 | 0.09 | 3551987 | 17.71 |
| C | 90 | 4 | 5.5 | 3.8 | 0.09 | 3641272 | 19.35 |
| D | 95 | 5 | 5.3 | 3.6 | 0.08 | 4092802 | 21.35 |
| E | 100 | 5 | 5.0 | 3.5 | 0.08 | 4111158 | 23.53 |
| F | 105 | 5 | 4.9 | 3.4 | 0.07 | 3695710 | 25.30 |
| G | 110 | 5 | 4.8 | 3.3 | 0.07 | 3776898 | 27.16 |
| H | 115 | 6 | 4.6 | 3.1 | 0.06 | 3867585 | 19.87 |
| I | 120 | 6 | 4.5 | 3 | 0.06 | 3929341 | 32 |
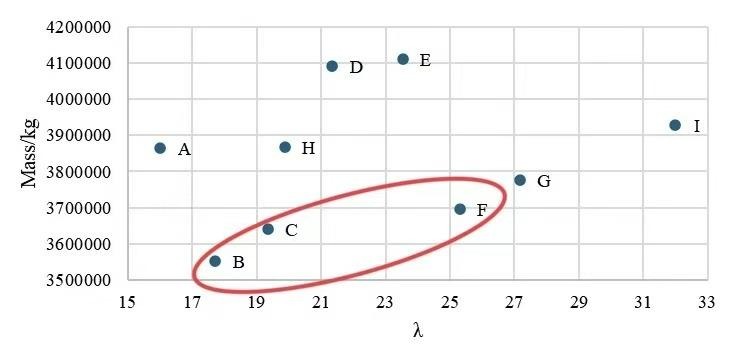
Fig.1 Mass vs Slenderness Ratio of OWT Tower Design Alternatives
4.2 Discussion
A comparison of the 9 design alternatives indicates that tower height, bottom diameter, and wall thickness are the primary controlling factors affecting tower mass and slenderness ratio. As tower height increases (80–120 m), if the diameter and wall thickness are proportionally reduced, the tower mass does not increase monotonically; however, the slenderness ratio rises significantly, indicating increased flexibility and reduced overall stability.
For the slenderness ratio, certain designs exhibit high overall stiffness and relatively low wind-induced vibration responses, while intermediate designs show a trade-off between mass and flexibility. For designs with very high slenderness, tower flexibility increases substantially, making both buckling capacity and fatigue life more sensitive to wind loading; such configurations should therefore be applied with caution in engineering practice. These trends are consistent with typical offshore tower design principles, which recommend that the slenderness ratio should not exceed 25–28 to avoid excessive flexibility and associated dynamic amplification effects.
For the mass, although taller towers theoretically require more material, the present study achieves weight reduction by simultaneously reducing diameter and wall thickness. As a result, the overall tower mass exhibits fluctuations rather than monotonically increasing with height. For example, F has a mass of only 3695 t, one of the lowest among all alternatives, demonstrating a “tall but lightweight” optimization trend. In contrast, some mid-height designs (D and E) show higher overall mass due to insufficient proportional reduction in cross-sectional parameters, indicating lower material efficiency.
4.3 Optimal Design Selection
Considering tower mass, slenderness ratio, structural stability, and manufacturing economy, three optimal designs were selected from ten alternatives for further detailed analysis. The recommended designs are as follows:

This design falls within the low slenderness ratio range, exhibiting the highest structural stiffness and buckling resistance. The diameter and wall thickness are appropriately configured, resulting in material consumption significantly lower than that of Alternative A. This design combines high stability with good material efficiency, making it the most robust general-purpose option.

This alternative lies within the optimal engineering range for OWT towers. It has a moderate slenderness ratio, well-controlled mass, and balanced cross-sectional parameters, representing the most commonly adopted scale combination in engineering practice. This design achieves a favorable balance among stiffness, mass, and manufacturability.

Among the high-tower alternatives, F exhibits the best overall performance. Its mass is among the lowest of all options, and although the slenderness ratio approaches the upper limit for flexibility, it remains within an acceptable structural range. This design offers significant economic advantages in scenarios demanding tall yet lightweight towers.
5 Conclusion
A parametric model of the OWT tower was developed based on Dynamo, enabling rapid comparison of multiple design alternatives by adjusting key geometric parameters. This study focused on tower segment mass and overall tower slenderness ratio as core performance indicators, analyzing and comparing nine design alternatives. Three optimal designs were ultimately identified, providing effective guidance for preliminary design selection in OWT tower engineering.
Reference
[1] Standardization Administration of China. (2015). GB/T 31517-2015: Offshore wind power—Technical requirements for towers. China Standards Press.
[2] Lagaros, N. D., & Karlaftis, M. G. (2016). Life-cycle cost structural design optimization of steel wind towers. Computers & Structures, 174, 122-132.