Based on the maintenance types, intervention intervals, and activity durations defined within the initial maintenance strategy, a bi-objective optimization analysis was performed for integrated maintenance scenarios. In this analysis, the total system downtime and the minimum time spacing between maintenance interventions were considered as the two main optimization objectives.
Within the defined boundaries and accepted maintenance ranges, a total of 136 different maintenance scenarios were generated. Among these scenarios, the solutions that perform best with respect to both objectives are located on the Pareto optimal front, shown as the blue line in the graph. These solutions illustrate the fundamental trade-off between maintenance frequency and service interruption at the system level.
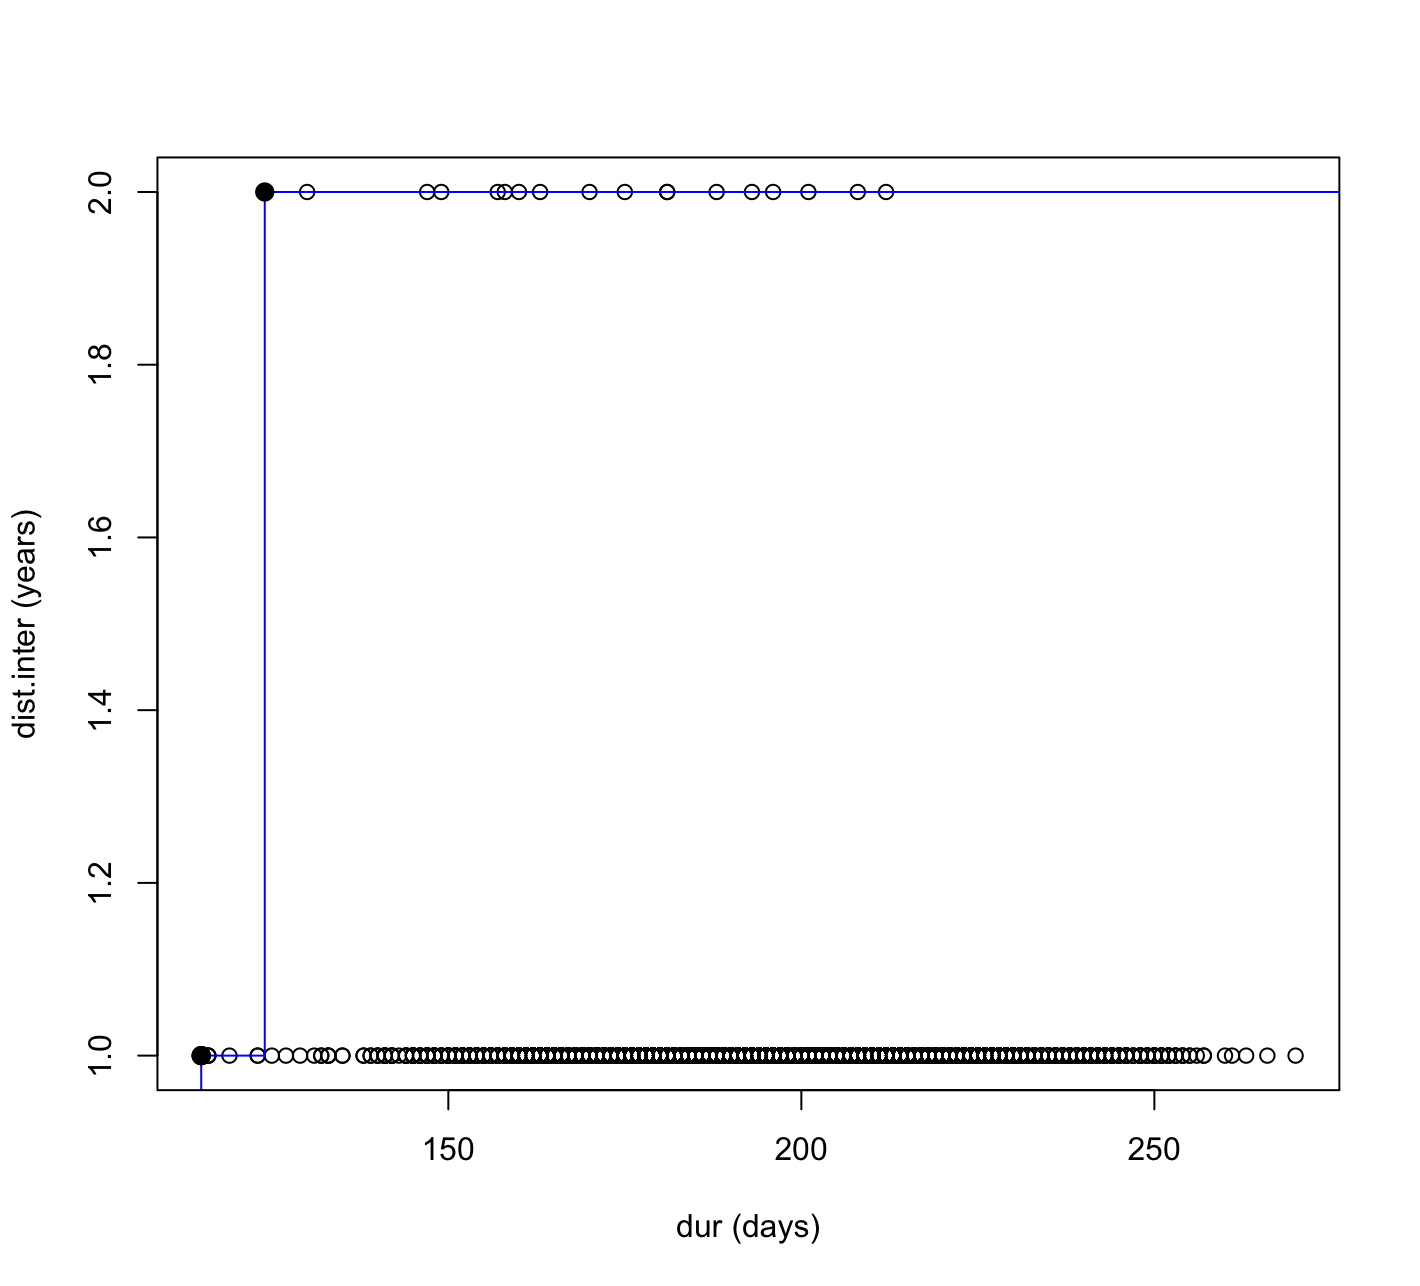
When the results (shown in figure 1.b) are evaluated within the context of the initially defined maintenance strategy, the findings largely confirm the adopted system level approach. The main objective of this strategy was to minimize the total system downtime while, at the same time, aligning maintenance activities as much as possible within the same time periods. In general, reducing service interruption was considered the primary performance goal.
The generated scenarios show that the minimum time spacing between maintenance interventions cannot be represented by a single optimal value but rather exhibits a certain degree of flexibility. This is also reflected by the fact that the Pareto optimal solutions do not converge to a single point. Instead, the results indicate a clear trade-off between minimizing total service interruption and increasing the time between interventions.
For example, one scenario located in the lower left region of the graph provides the lowest total downtime while maintaining a minimum spacing of approximately one year between interventions. In contrast, alternative scenarios with slightly higher service interruption achieve a minimum spacing of about two years. In this sense, the analysis does not aim to identify the single best solution, but rather to present a set of feasible and meaningful alternatives that can be aligned with the selected maintenance strategy.
From a more quantitative perspective, the solutions are clustered around minimum spacing values of
one and two years. This behavior is primarily driven by the relatively frequent maintenance
requirements of several subsystems, particularly surface repair activities. Although inspection activities were excluded from the analysis due to their negligible impact on cost and interruption, the remaining frequent interventions significantly influence the spacing between maintenance events.
Overall, the system does not enforce a unique maintenance interval but instead exhibits a pyramid like behavior: shorter minimum spacing values allow a wider range of service interruption outcomes, while increasing the spacing leads to a narrower and more restrictive solution space. This behavior is consistent with the expectations for system level maintenance planning involving multiple interacting subsystems.
LCA & Multi-Objective Analysis >>
Home | System Definition | Scenario 1 | Scenario 2 | Scenario 3 | Scenario 4 | Discussion | Appendix