1. Introduction
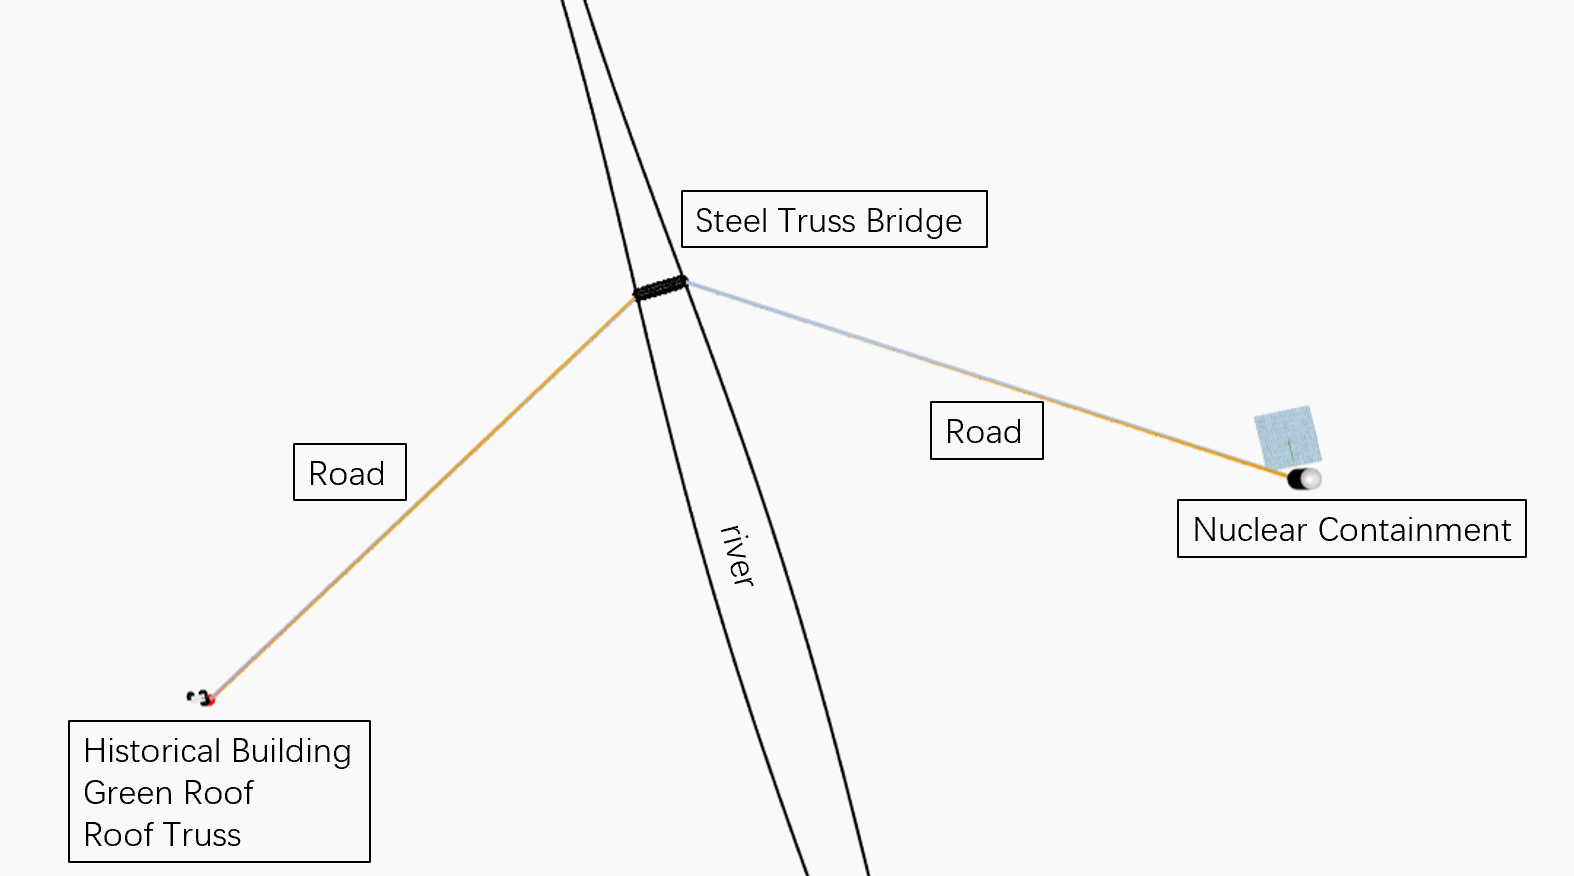
The combined parametric model integrates three coupled subsystems into a single infrastructure: (i) a nuclear containment facility, (ii) an abandoned historical masonry building, and (iii) a bridge–road access system. The cleared land across the river provides a suitable and isolated location for the nuclear containment structure, ensuring safety and spatial separation, while the river itself can serve as a potential cooling resource. The existing masonry building is repurposed as a maintenance facility and structurally upgraded through a truss-based intervention, and a green roof is introduced to enhance environmental performance. A permanent road connection and a truss bridge spanning the river ensure reliable access for operation, logistics, and emergency services.
2. Integrated System and Parametric Features
Because all subsystems are parametric, the coupled infrastructure must remain flexible in design and implementation. The nuclear facility is positioned on the cleared land across the river, with key geometric parameters (e.g., footprint and radius) remaining adaptable within defined constraints. The river functions as the main environmental boundary condition: it separates safety-critical infrastructure, defines the bridge crossing length, and is considered as a potential cooling resource.
2.1 Nuclear Containment System
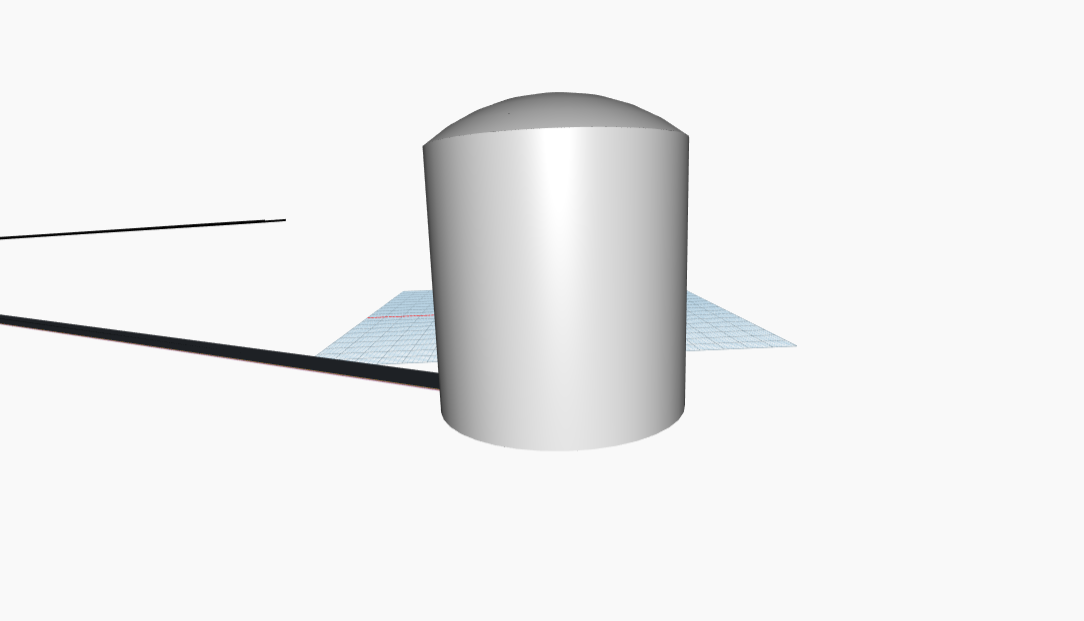
The nuclear containment system is modeled as largely independent from a structural standpoint, but connected to the overall infrastructure via the road network. Economic performance is evaluated using a simplified profit rate of €4,000 per m², establishing a direct link between containment size and expected rental income.
2.2 Historical Building Upgrade and Green Roof
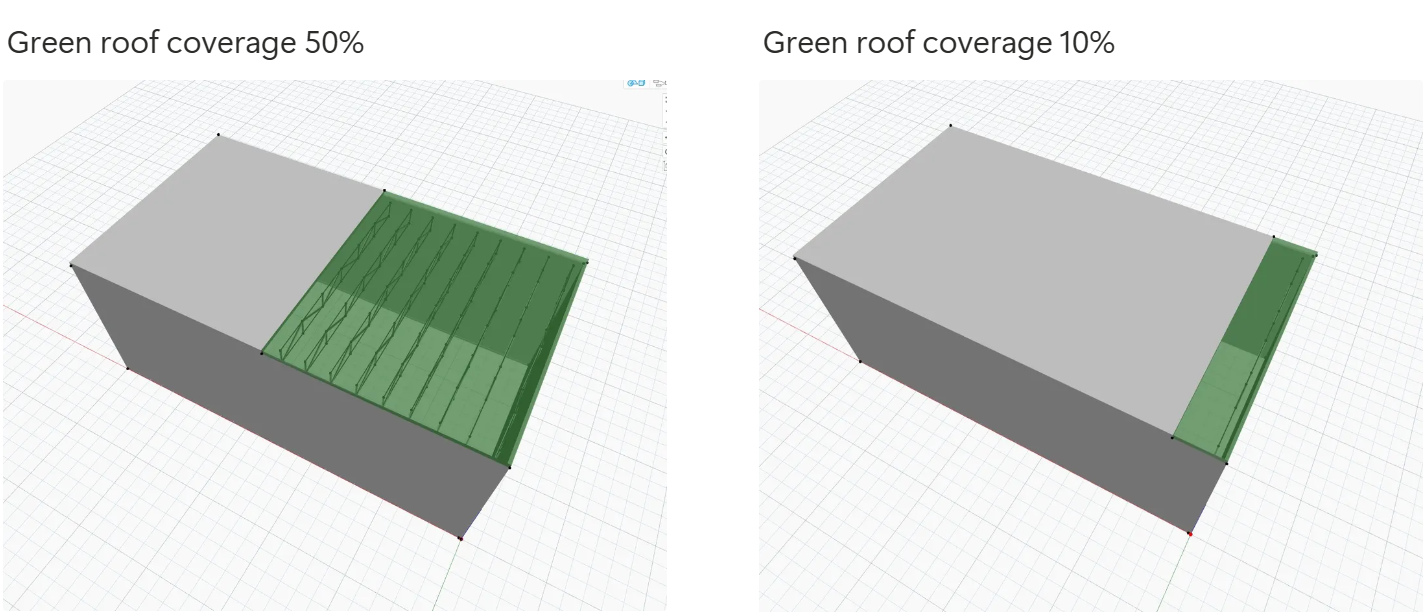
The historical building subsystem retains the existing masonry structure and upgrades it through a truss system, enabling continued use as a maintenance facility while allowing systematic variation of the strengthening intervention. The roof solution is parameterized through an adjustable green roof coverage ratio, enabling environmental trade-offs while remaining consistent with the structural upgrade logic.
2.3 Bridge–Road Access System
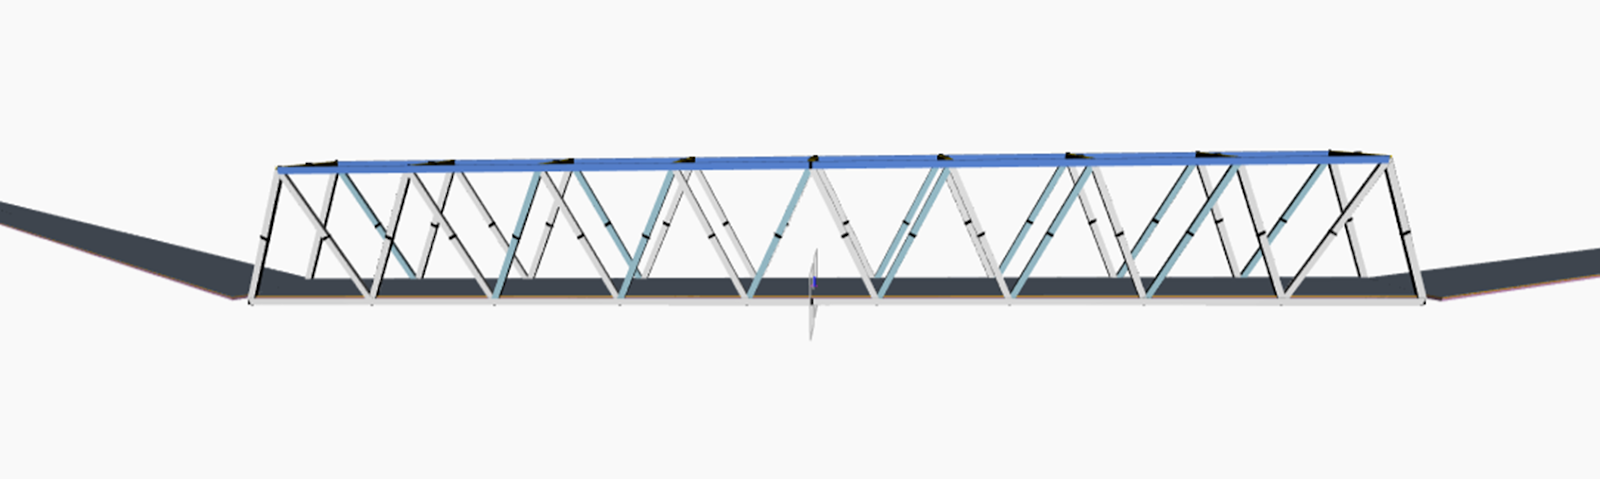
The bridge–road access system acts as the operational enabler for logistics and emergency services, with geometry and configuration flexible to match evolving building parameters. Bridge and road are implemented as one coupled system, where the road surface is placed on the bridge deck; since the structural load is carried by the bridge structure itself, the road thickness on the deck section can be reduced accordingly. Road segments connect to both ends of the bridge to form a continuous transportation network.
2.4 River Geometry and Fixed Boundary Conditions
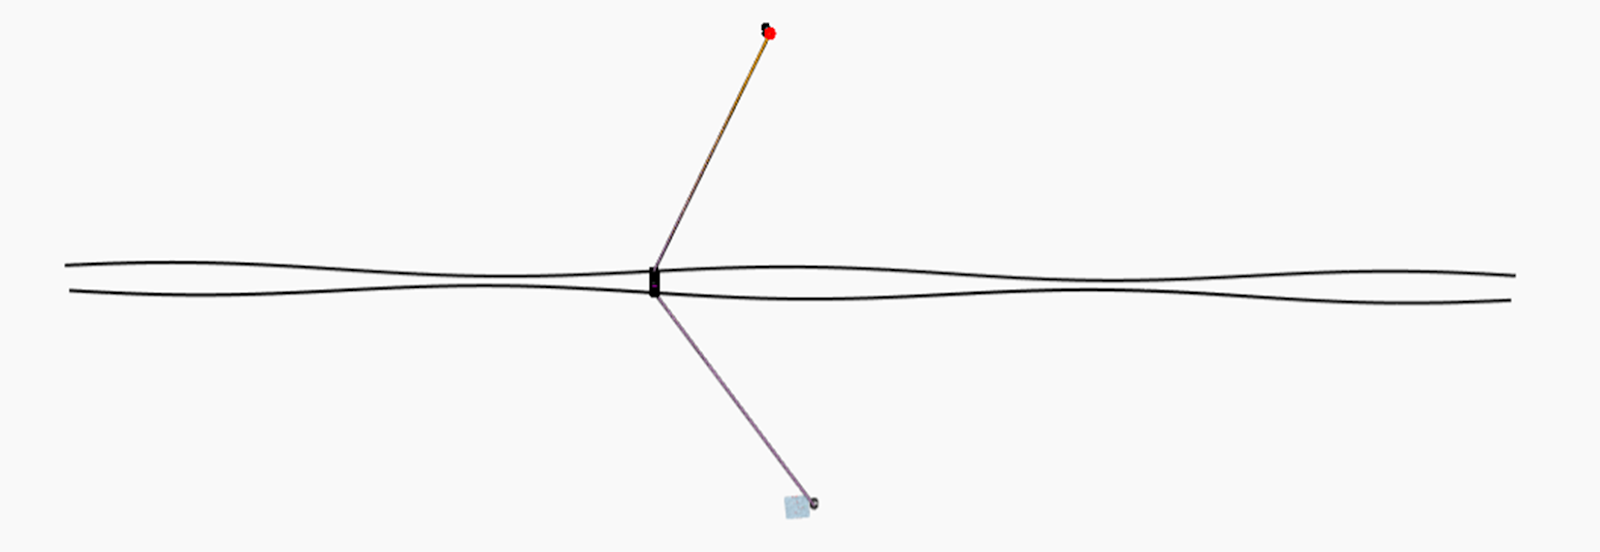
To reflect the river geometry, the river is modeled as a fixed environmental system defined by two non-parallel curves, introducing a geometric constraint that makes bridge positioning a key design variable. The distance between the nuclear containment facility and the historical building is fixed at 2,000 m, with both buildings located 1,000 m from the river. The combined integrated model is shown in the figures below.
2.5 Bridge Offset Study (Position Markers)
Bridge position is adjusted along the y-axis, which directly changes the length of both bridge and connecting road and therefore affects material quantities, construction cost, and embodied CO₂ emissions. Due to the “fish-belly” shape of the river, a direct crossing at the widest location requires a longer bridge with higher CO₂ and cost, whereas shifting the bridge upstream shortens the span but increases the approach road length. The system therefore contains a bridge–road trade-off, and an optimal bridge position must be identified to minimize cost and emissions while maintaining overall performance.
In the model, the trend between bridge offset position and both CO₂ and cost was explored by manually adjusting the bridge offset in Dynamo.
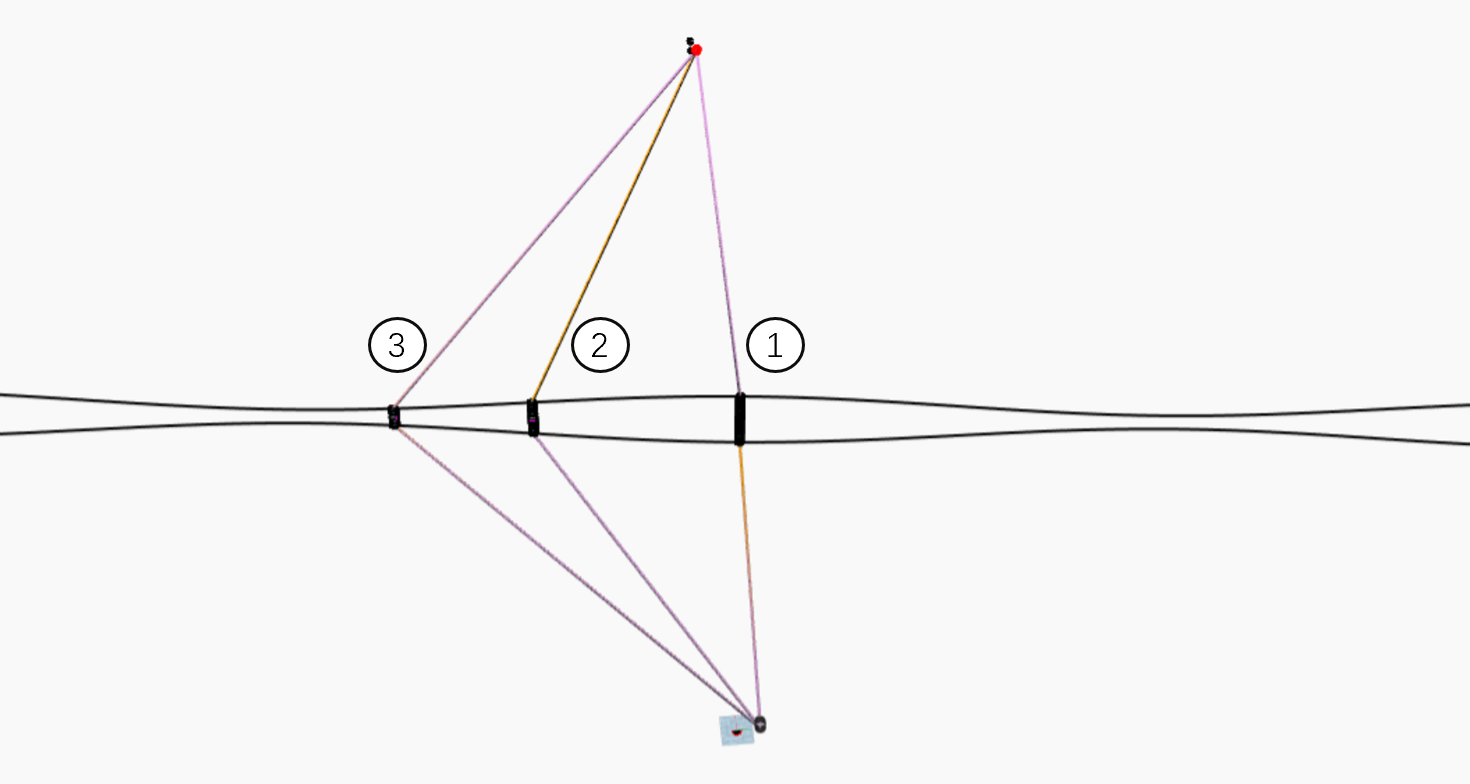
The numerical markers in Figure 1 represent specific bridge offset positions: (1) = 0, (2) = 600, and (3) = 1000.
3.Design Challenge
3.1 Objective and CO₂ Constraint
The design challenge is to maximize economic return (ROI) under a strict total CO₂ emission cap of 2,070,000 kg set by the municipality. This tight cap limits the scalability of the nuclear system and requires a strategic allocation of CO₂ across the nuclear, bridge–road, and historical building systems.
3.2 Coupling Effect: CO₂ Reinvestment into Nuclear Revenue
A key coupling effect is that CO₂ savings achieved in the bridge–road and historical building systems can be “reinvested” into expanding the nuclear system. Since the nuclear facility generates income through rental revenue, allocating freed-up CO₂ budget to nuclear expansion directly increases the project’s economic return while still staying within the overall municipal cap.
4.Evaluation Framework
High Performance Criteria (HPC):
HPC 1: Return on Investment (ROI)
ROI is defined as the ratio between rental income and total construction cost. Maximizing total profit alone may lead to inefficient solutions with disproportionately high investments; ROI therefore provides a more meaningful indicator of economic performance.
HPC 2: Remaining CO₂ Budget
The remaining CO₂ budget represents the margin between the emission cap and actual embodied emissions. This reserve increases robustness against uncertainty and preserves flexibility for potential future modifications or upgrades.
5.Design Parameters
- Bridge Position (y-offset): Controls the bridge–road trade-off and directly affects bridge length, road length, cost, and embodied CO₂.
- Nuclear Containment Radius: Determines usable floor area and therefore rental income; increasing radius improves revenue potential but raises cost and embodied CO₂.
- Green Roof Coverage Ratio: Influences environmental performance and structural loading on the historical building; higher coverage can trigger additional reinforcement
6.Design Alternatives (Input Setups)
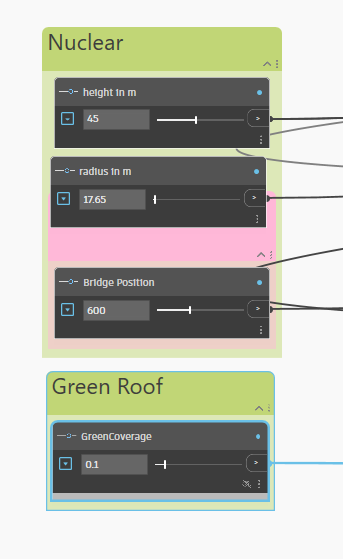
For the comparative analysis, five predefined input setups were established for the coupled system, as shown in Table 1.
| Setup | A | B | C | B.1 | C.2 |
| Nuclear height [m] | 45 | 45 | 45 | 45 | 45 |
| Nuclear radius [m] | 17.00 | 17.00 | 17.00 | 17.65 | 17.70 |
| Bridge position [y] | 1100 | 600 | 600 | 600 | 600 |
| Green roof coverage [%] | 10 | 10 | 50 | 10 | 50 |
Table 1: Input setups used for system comparison
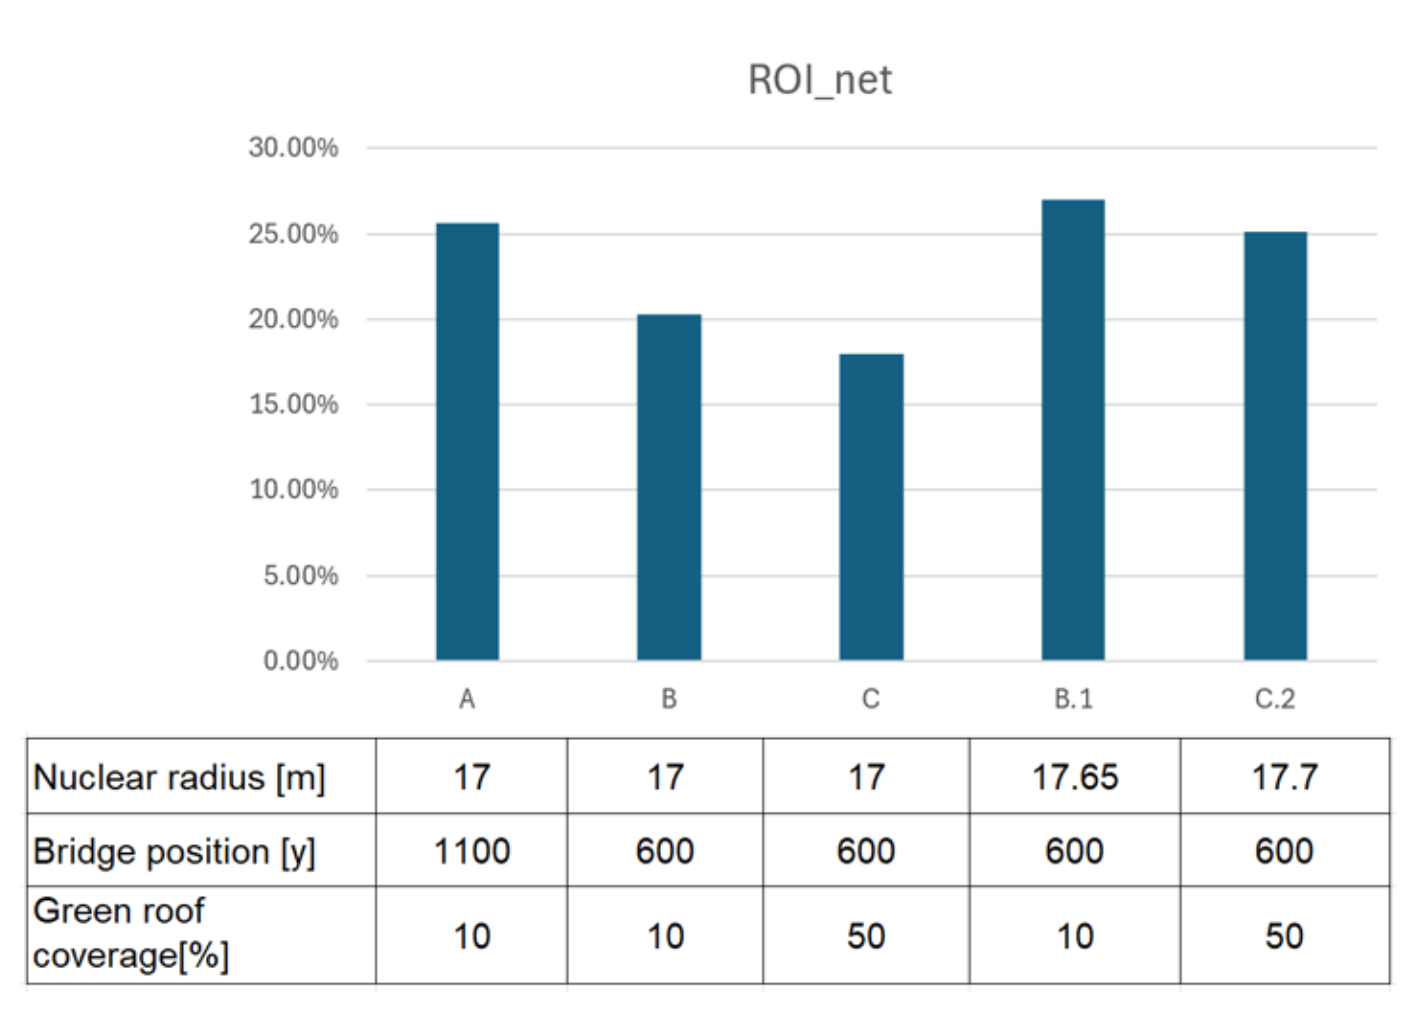
The five setups represent two stages of decision-making under the municipal CO₂ cap. Setups A, B, and C form the baseline comparison: they keep the nuclear system constant (R = 17 m) and isolate the effect of bridge positioning and roof greening on cost and embodied CO₂. Setups B.1 and C.2 represent the scaled step, where remaining CO₂ budget from the baseline configurations is converted into a larger nuclear radius to increase rental income. This structure enables a transparent comparison between (i) strategies that create CO₂ reserves and (ii) strategies that use those reserves to maximize economic return.
7.Outputs (Results)
The performance results for the five setups are summarized in Table 2.
| Setup | CO₂_total [kg] | Cost_total [€] | Rent income (20y) [€] | Net profit [€] | ROI_net |
| A | 2,064,626 | 2,686,621 | 3,373,618 | 686,997 | 25.6% |
| B | 2,007,127 | 2,804,957 | 3,373,618 | 568,661 | 20.3% |
| C | 2,003,526 | 2,858,247 | 3,373,618 | 515,371 | 18.0% |
| B.1 | 2,068,750 | 2,864,539 | 3,635,418 | 770,879 | 27.0% |
| C.2 | 2,069,944 | 2,922,466 | 3,655,963 | 733,497 | 25.1% |
Table 2: Output performance summary
8.Results and Discussion
8.1 Bridge–Road System (Position Sensitivity)
For the bridge–road subsystem, the bridge offset was varied along the y-axis and the resulting bridge+road cost and CO₂ were assessed. The analysis confirms that minimizing total transportation length does not automatically yield the best solution, because bridge structures are significantly more cost- and carbon-intensive than road segments. As the offset increases, the bridge span shortens while road length increases, creating a distinct trade-off.
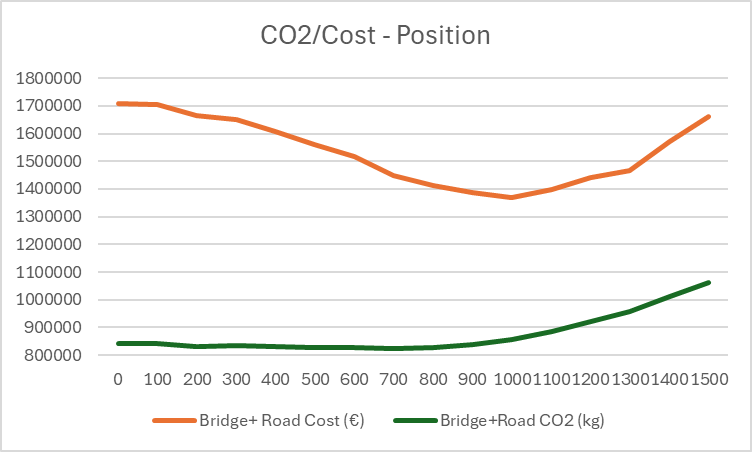
Since the position that minimizes cost does not align with the position that minimizes CO₂, two optima are identified:
- Environmental optimum (Position 600): lowest embodied CO₂, but at a higher total cost.
- Economic optimum (Position 1000): lowest cost, but higher CO₂ due to the longer road segments.
| Position | Bridge+Road Cost [€] | Bridge+Road CO₂ [kg] |
| 600 | 1,447,326 | 822,109 |
| 1000 | 1,369,889 | 854,895 |
Table 3: Comparison of optimal bridge positions (bridge+road only)
This confirms that bridge positioning is a high-impact lever: small geometric shifts can re-balance where embodied emissions and cost sit in the system (bridge-dominated vs. road-dominated).
8.2 Historical Building System (Green Roof Threshold)
The historical building subsystem evaluates whether the existing masonry walls can carry the additional loads from the timber trusses and the green roof. The model only adds masonry strengthening when the existing wall capacity is exceeded. Results indicate a critical threshold: up to 50% green roof coverage, the existing walls remain sufficient and the negative embodied CO₂ contribution of the timber system dominates, resulting in a total of −1,216 kg CO₂ for the intervention. At 60% coverage, the increased load triggers masonry strengthening, producing a step-change to +3,665 kg CO₂. This assessment accounts only for manufacturing emissions (A1–A3) and does not include operational benefits such as cooling effects.
The implication is that roof greening behaves non-linearly: it can remain “cheap” in CO₂ terms up to a threshold, but becomes significantly more CO₂-intensive once structural strengthening is required.
8.3 Integrated System Performance (Baseline vs. Scaled Setups)
Under the municipal cap, the baseline setups (A, B, C) show that Setup A achieves the highest ROI among baselines but operates close to the CO₂ cap, leaving little robustness. Setup B strategically uses bridge positioning to create CO₂ reserves while keeping the nuclear system unchanged. Setup C reduces CO₂ slightly further through higher roof greening but at higher cost and lower ROI.In the scaled step, the remaining CO₂ budget is used to increase the nuclear radius (B.1 and C.2). Since rental income is generated only by the nuclear system, converting CO₂ reserves into additional nuclear area is the most effective way to improve overall ROI under the cap. The scaled results show that both baselines become economically stronger once reserves are reinvested into nuclear expansion; however, the Balanced scaled setup (B.1) performs best overall by combining CO₂ compliance, strong ROI, and improved robustness.
References
1.Search | Database | ÖKOBAUDAT