Maintainace optimisation
Railways are a vital part of everyday life, providing essential connections for commuters and long-distance travellers. Effective maintenance planning is therefore crucial to minimise service disruptions and ensure reliable passenger access. Unlike many other types of systems, railway stations measure serviceability not by full system availability, but by maximising the time during which at least one track remains operational. Maintaining partial functionality allows services to continue even during maintenance activities, reducing inconvenience for users.
This project explores four integrated maintenance strategies designed to improve infrastructure performance over the long term. The main objectives are to reduce passenger disruption and enhance overall system reliability. By coordinating maintenance activities across different systems, the project aims to ensure that critical components are serviced efficiently and at appropriate intervals.
Through strategic planning and optimisation, these approaches also seek to lower long-term operational and maintenance costs. By aligning technical performance with user needs, the project demonstrates how carefully designed maintenance strategies can contribute to a more resilient, sustainable, and user-focused railway network.
Lifespan and operation
The total lifespan of the integrated railway station system is set at 120 years. This duration is modelled after Hamburg Central Station, which opened in 1906 and remains one of Germany’s oldest operational railway hubs. This historical precedent provides a realistic benchmark for the service life of major transit infrastructure. Similar to the Berlin S-Bahn and other international metropolitan networks, it is assumed that the station remains accessible, but specific tracks may be shut overnight during weekdays. This operational window allows many maintenance activities to be conducted during the night shift with zero impact on daytime service availability. Only maintenance activities with a duration above 0 days will be considered in this study.
Pre-optimised timelines
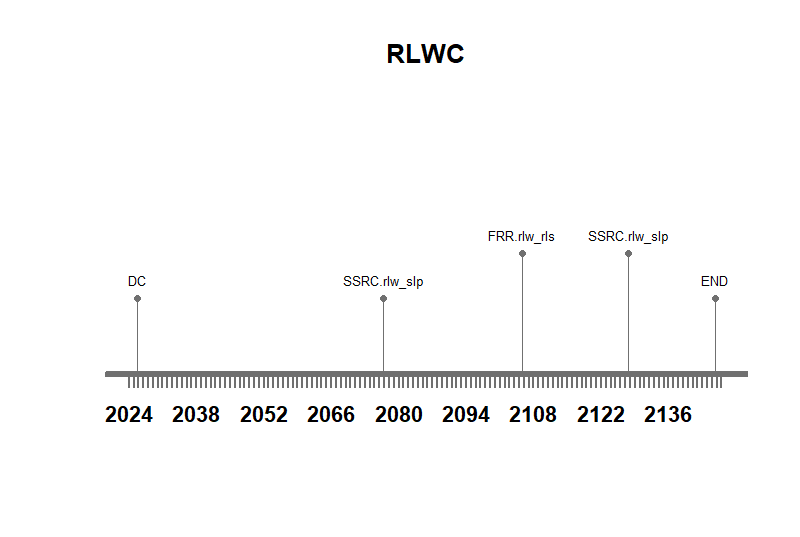
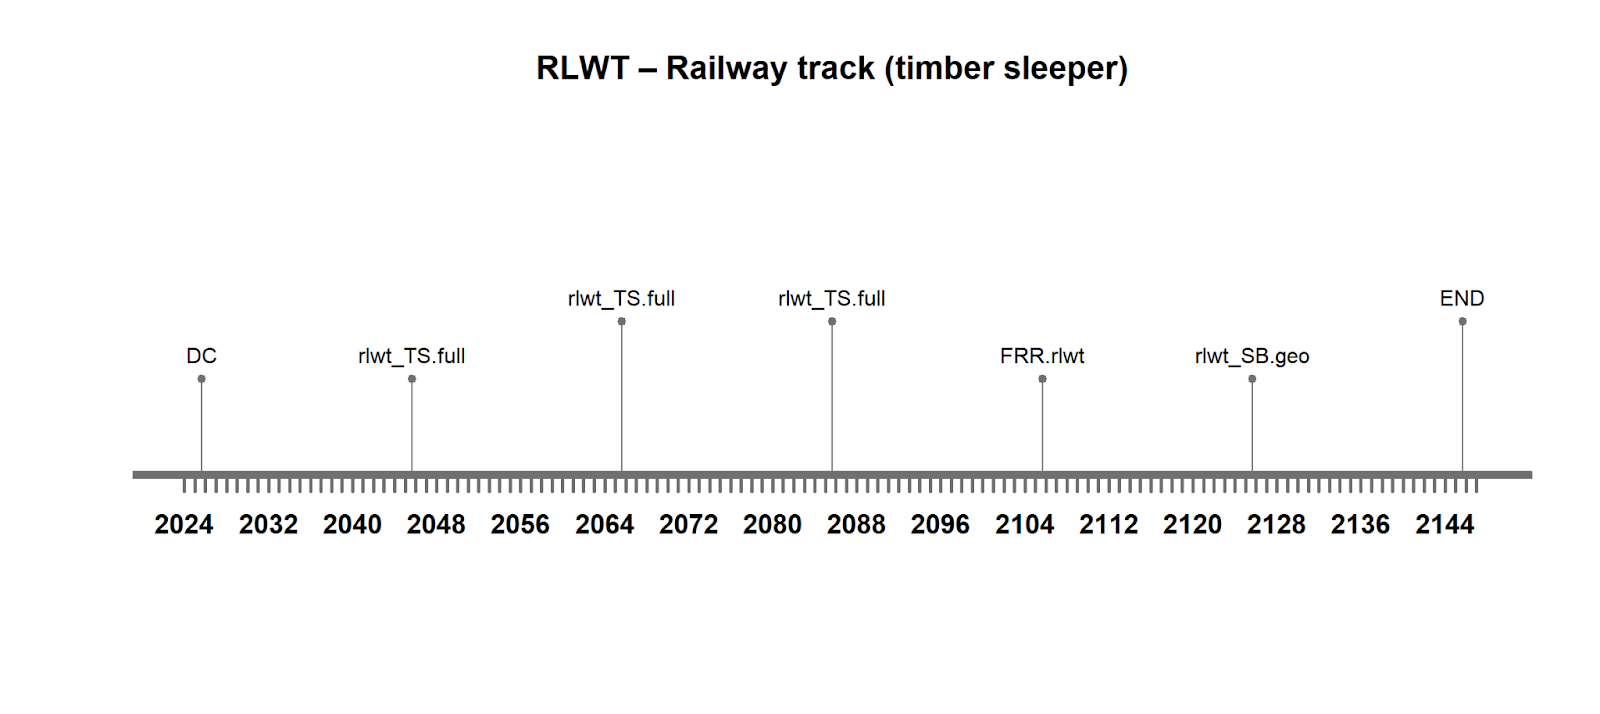
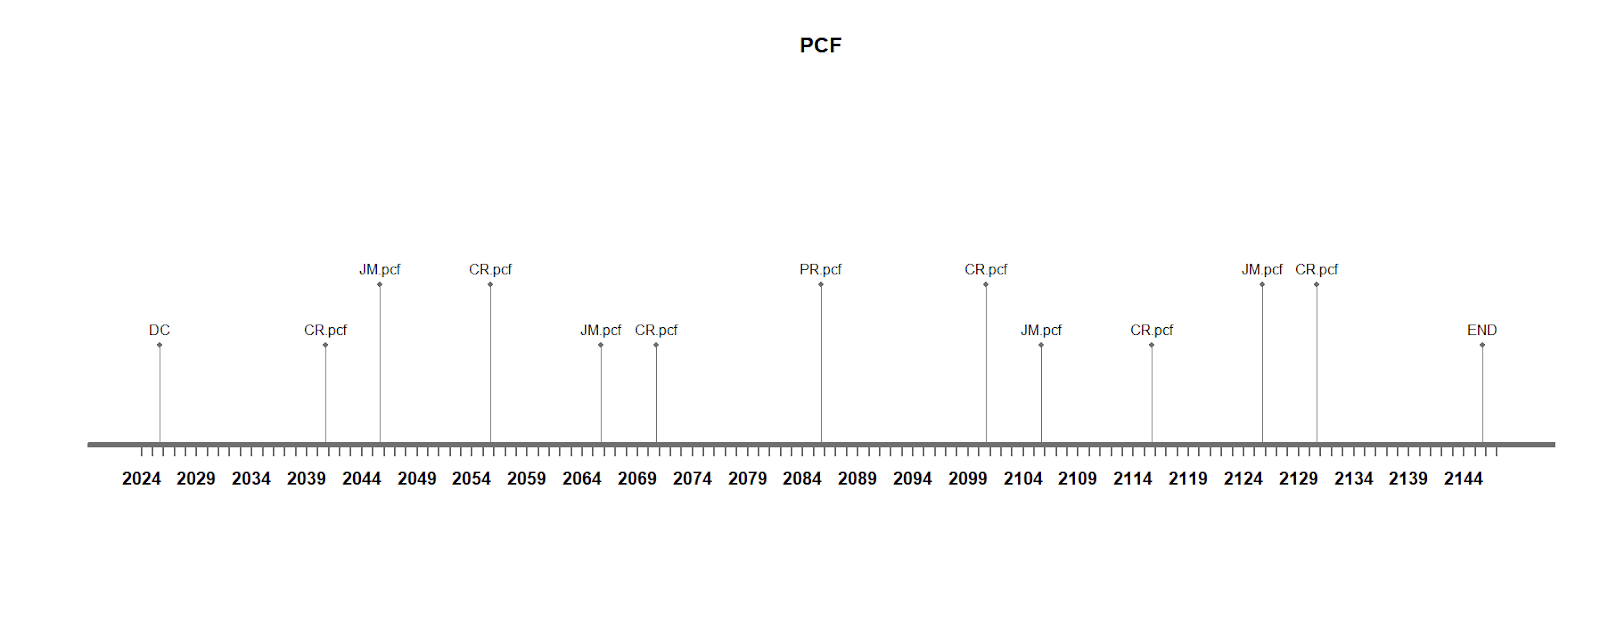
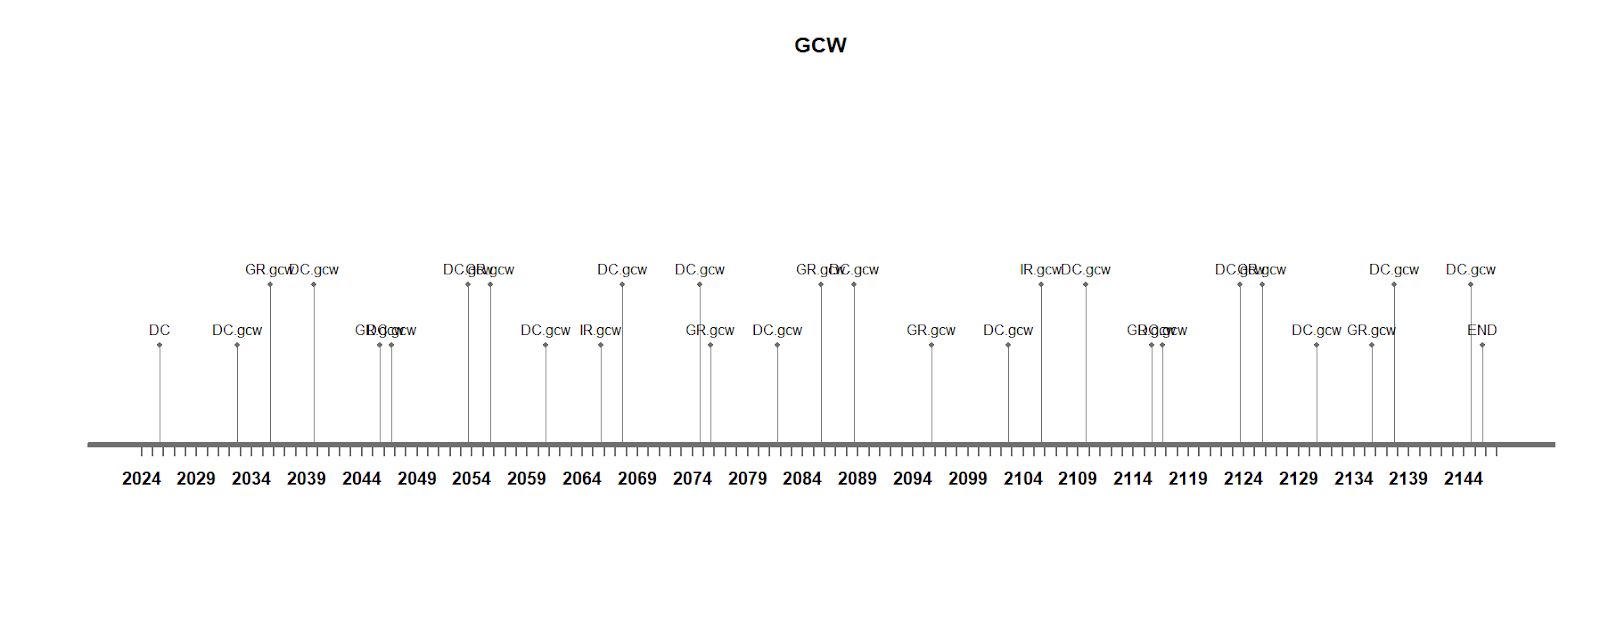
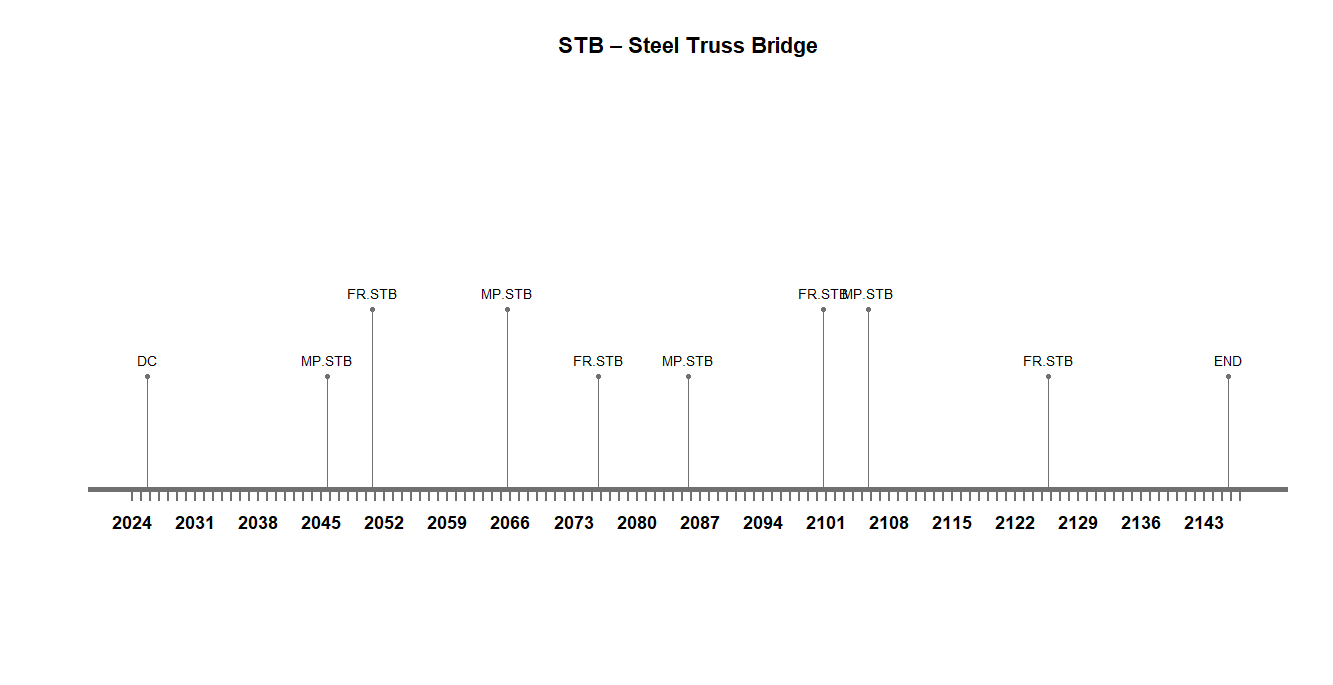
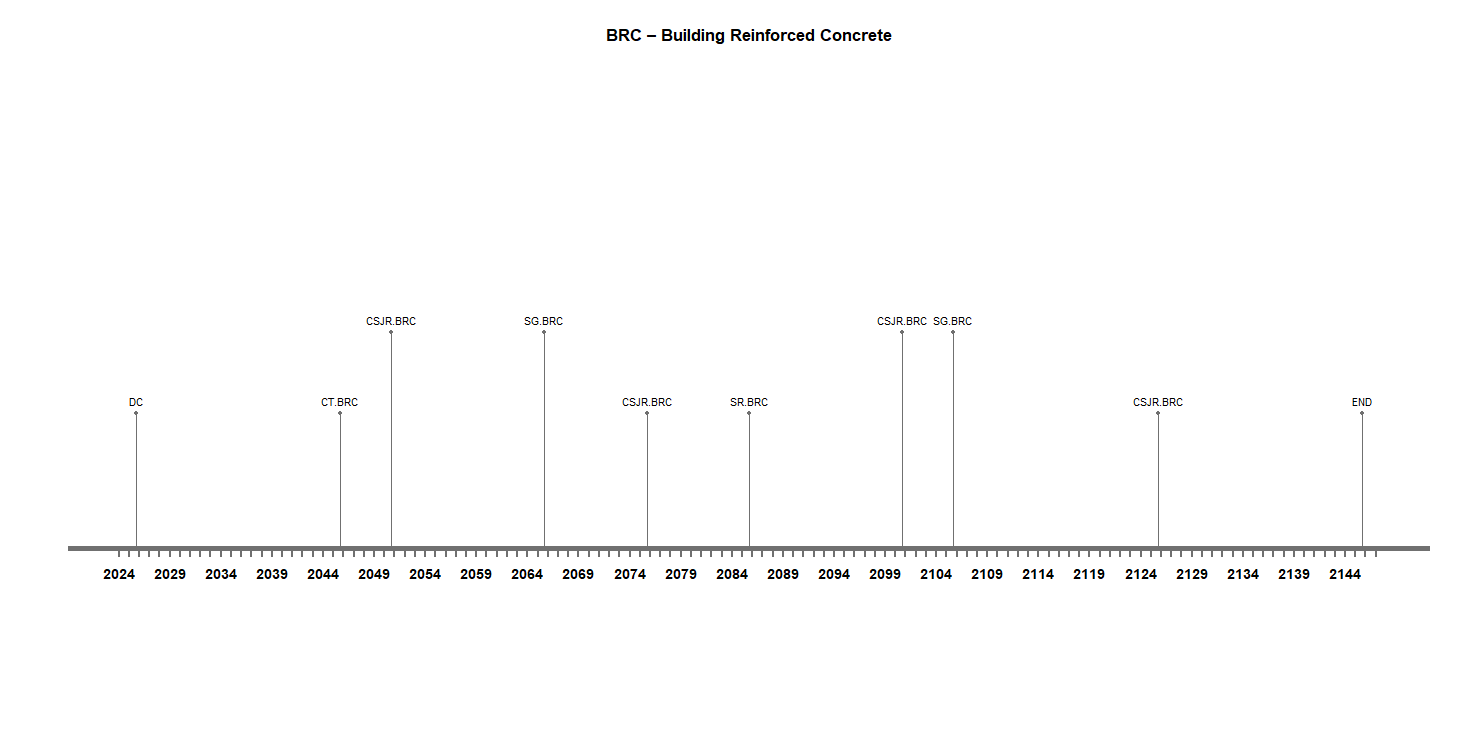
The pre-optimised standard frequencies of the maintenance interventions shown in Table 1 were used to create initial maintenance timelines for each system (Figures1-6). These baselines represent the current approach before maintenance strategies were applied,
The upper and lower range frequencies define the admissible window for each intervention. These ranges serve as constraints for the optimisation used in Strategies 1 to 4, allowing the model to shift maintenance dates to achieve the best balance among cost, environmental impact, and station downtime.
| Systems | EventCode | Intervention | Lower Range Frequency (years) | Upper Range Frequency (years) | Standard Frequency (years) | Duration (days) |
| Precast Concrete Facade [1] | CR.pcf | Coating Refresh | 12 | 18 | 15 | 3 |
| JM.pcf | Joint Maintenance | 15 | 25 | 20 | 5 | |
| PR.pcf | Panel Replacement | 40 | 60 | 60 | 10 | |
| Glass Curtain Wall | DC.gcw | deep cleaning [6] | 5 | 10 | 7 | 3 |
| GR.gcw | gasket replacement [5] | 8 | 14 | 10 | 5 | |
| IR.gcw | IGU replacement [4] | 40 | 60 | 40 | 14 | |
| Steel Truss Bridge | MP.stb | Member Replacement | 10 | 20 | 15 | 7 |
| FR.stb | Full Recoating | 20 | 30 | 25 | 21 | |
| Building Reinforced | SR.brcs | Spall Repair | 5 | 70 | 60 | 21 |
| CS/JR.brcs | Crack Sealing / Joints Refurbishment | 20 | 30 | 25 | 7 | |
| CT.brcp | Carbonation Treatment | 15 | 25 | 20 | 5 | |
| SG.brcf | Structural Grounding | 30 | 50 | 40 | 41 | |
| Railway Track Concrete sleepers | SSRC.rlw_slp | Systematic sleeper renewal campaign | 40 | 60 | 50 [7] | 5 |
| FRR.rlw_rls | Full Rail Renewal | 60 | 100 | 80 [8] | 1.25 | |
| Railway Track Timber sleepers | rlwt_TS.full | Full sleeper renewal | 15 | 30 | 20 [2] | 1 |
| rlwt_SB.geo | Geotextile full replacement | 80 | 120 | 100 [3] | 14 | |
| FRR.rlwt | Full Rail Renewal | 60 | 100 | 80 | 1.25 |
Maintainance strategies
Strategy 1- Railway Asynchronous Maintenance
Goal
To allow continued service to the station while maintenance is carried out, only one line of track is closed at any given time. This enables the implementation of single-line working, ensuring that rail operations can continue while maintenance activities are undertaken on the adjacent track.
Approach
The two railways (timber sleeper and concrete sleeper)are treated as independent systems; they will have their maintenance work scheduled at different times wherever possible. The selection of the railway maintenance schedule was driven by filtering for solutions that contained no overlapping intersystem maintenance events. Conversely, intrasystem maintenance events were optimised for overlap to reduce the total closure duration for each specific track.

The original maintenance strategy has 6 different intervention types and in total 23.5 days of interruptions for a total lifetime of 120 years. This interruption duration is calculated with the standard frequencies.
| Systems | EventCode | Intervention | Lower Range Frequency (years) | Upper Range Frequency (years) | Duration (days) |
| Railway Track Concrete sleepers | SSRC.rlw_slp | Systematic sleeper renewal campaign | 40 | 60 | 5 |
| RM.rlw_rls | Rail milling | 2 | 5 | 0 | |
| FRR.rlw_rls | Full Rail Renewal | 60 | 100 | 1.25 | |
| Railway Track Timber sleepers | rlwt_TS.full | Full sleeper renewal | 15 | 30 | 1 |
| rlwt_SB.geo | Geotextile full replacement | 80 | 120 | 14 | |
| FRR.rlwt | Full Rail Renewal | 60 | 100 | 1.25 |
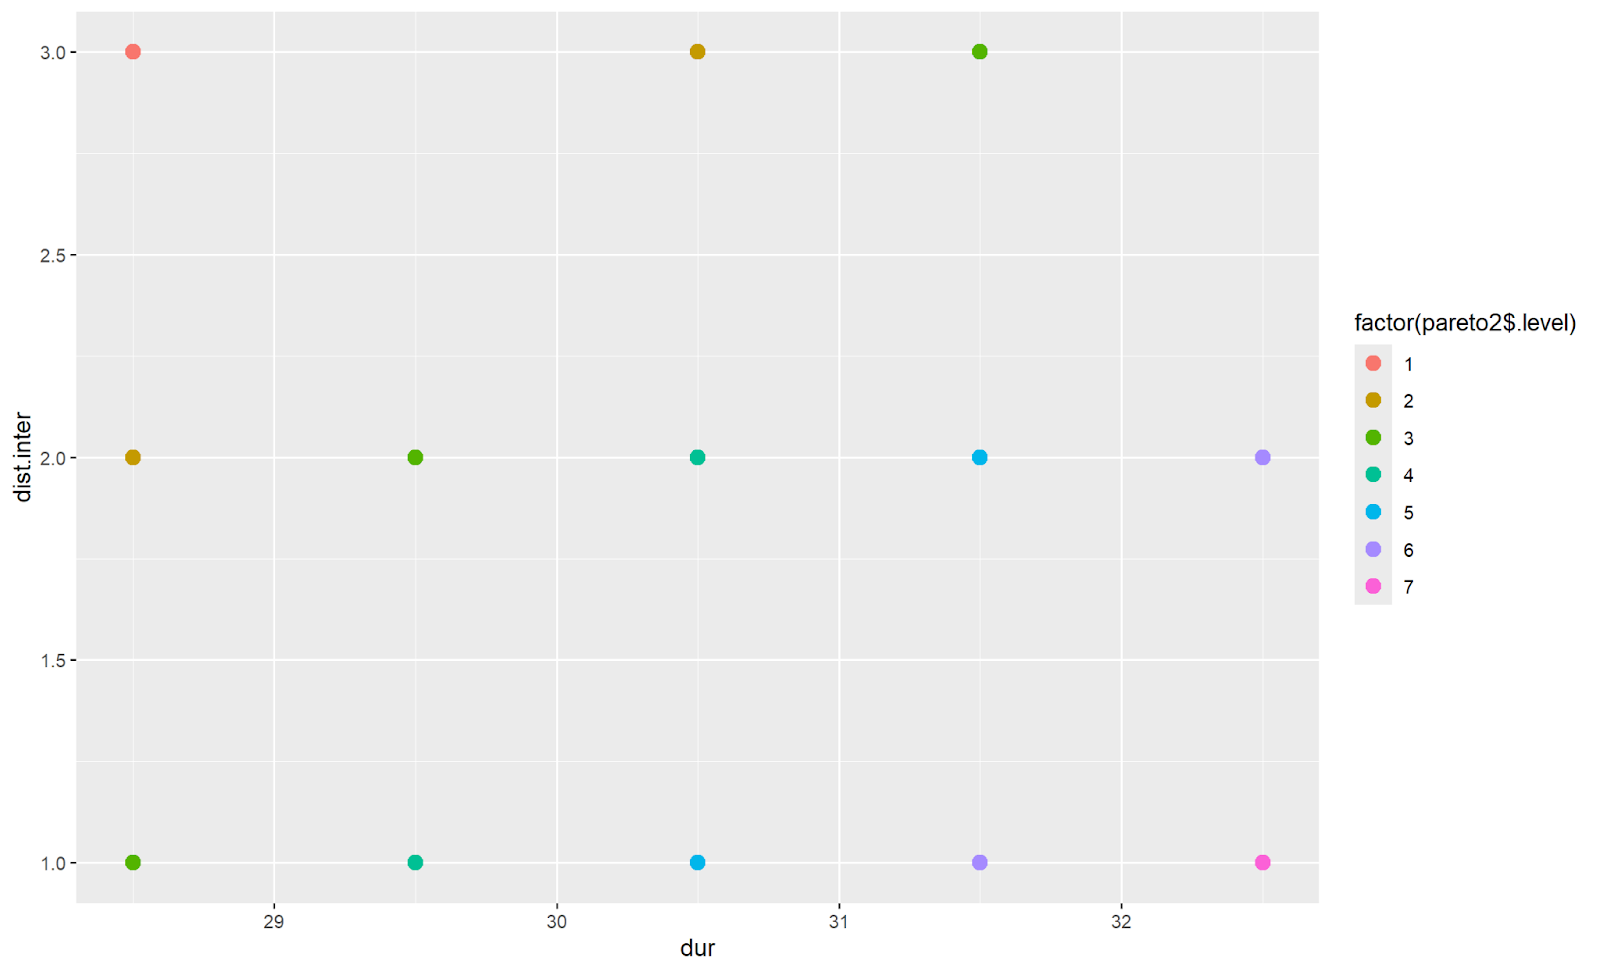
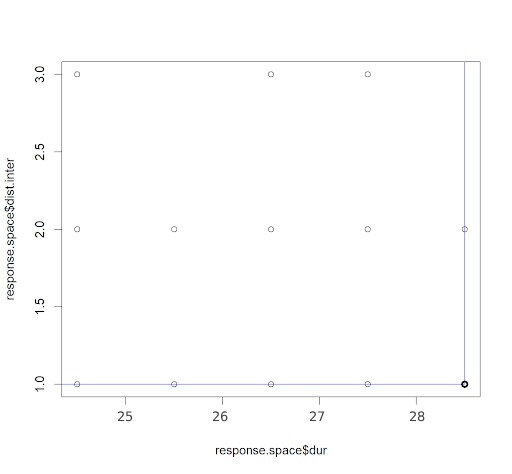
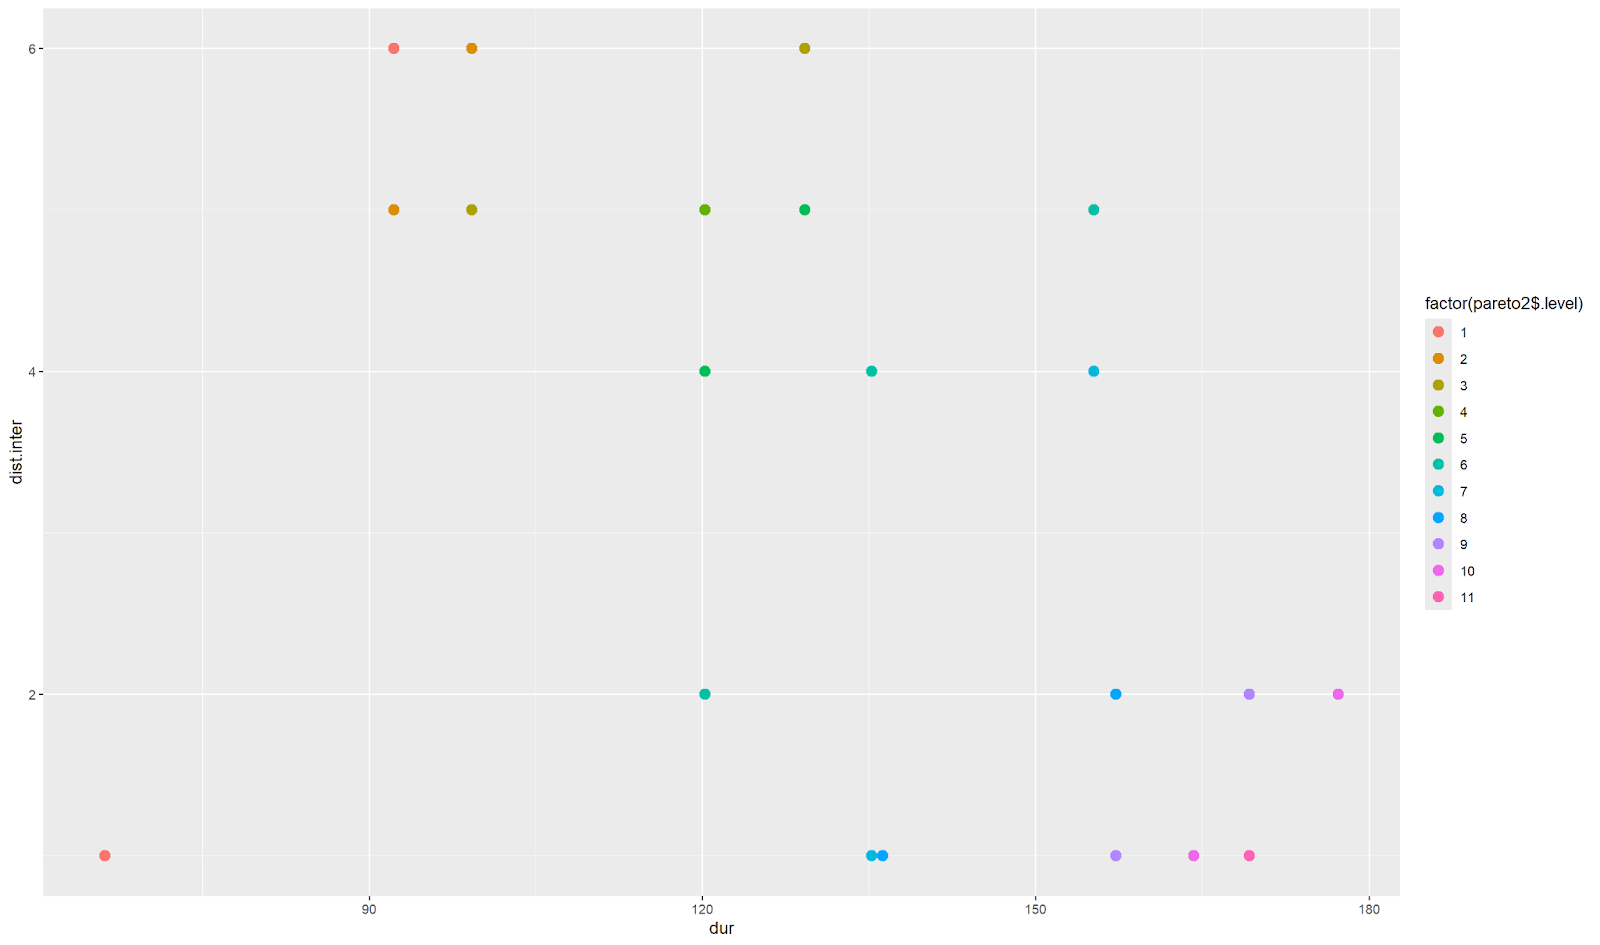
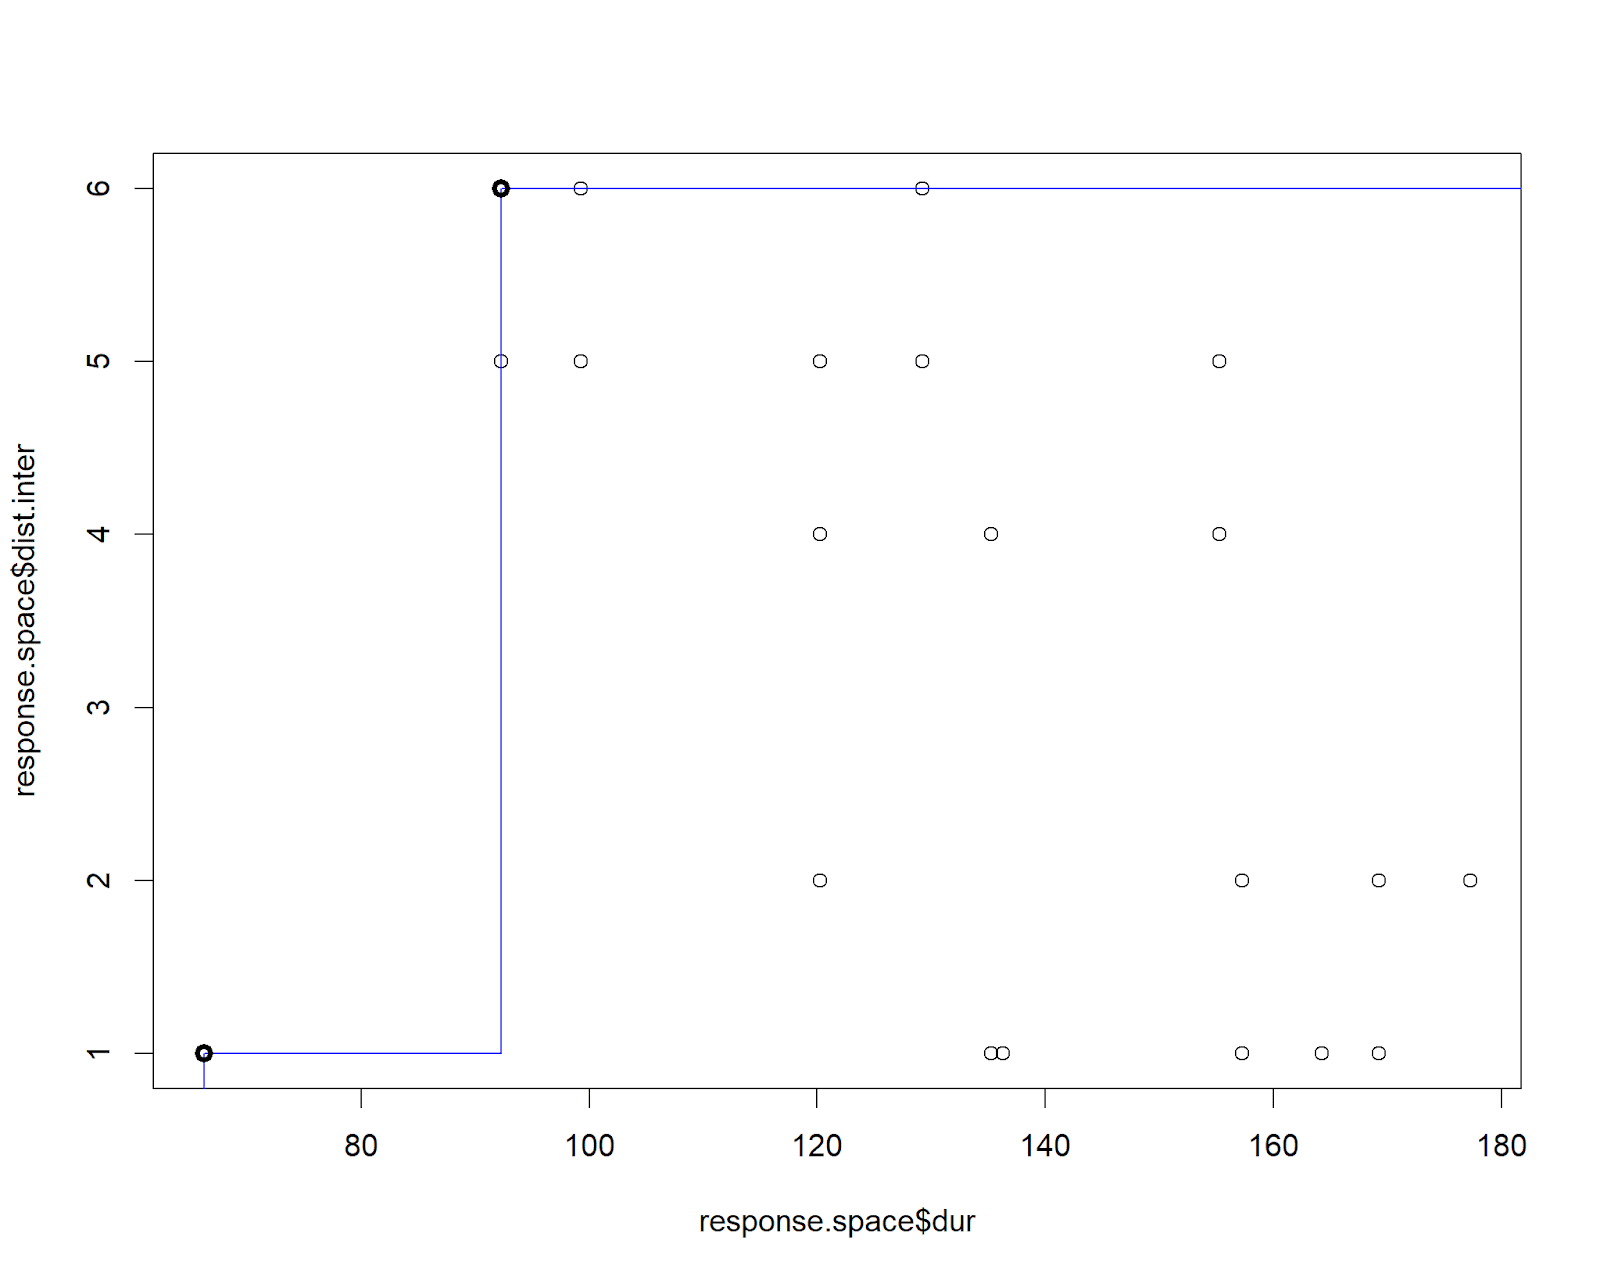
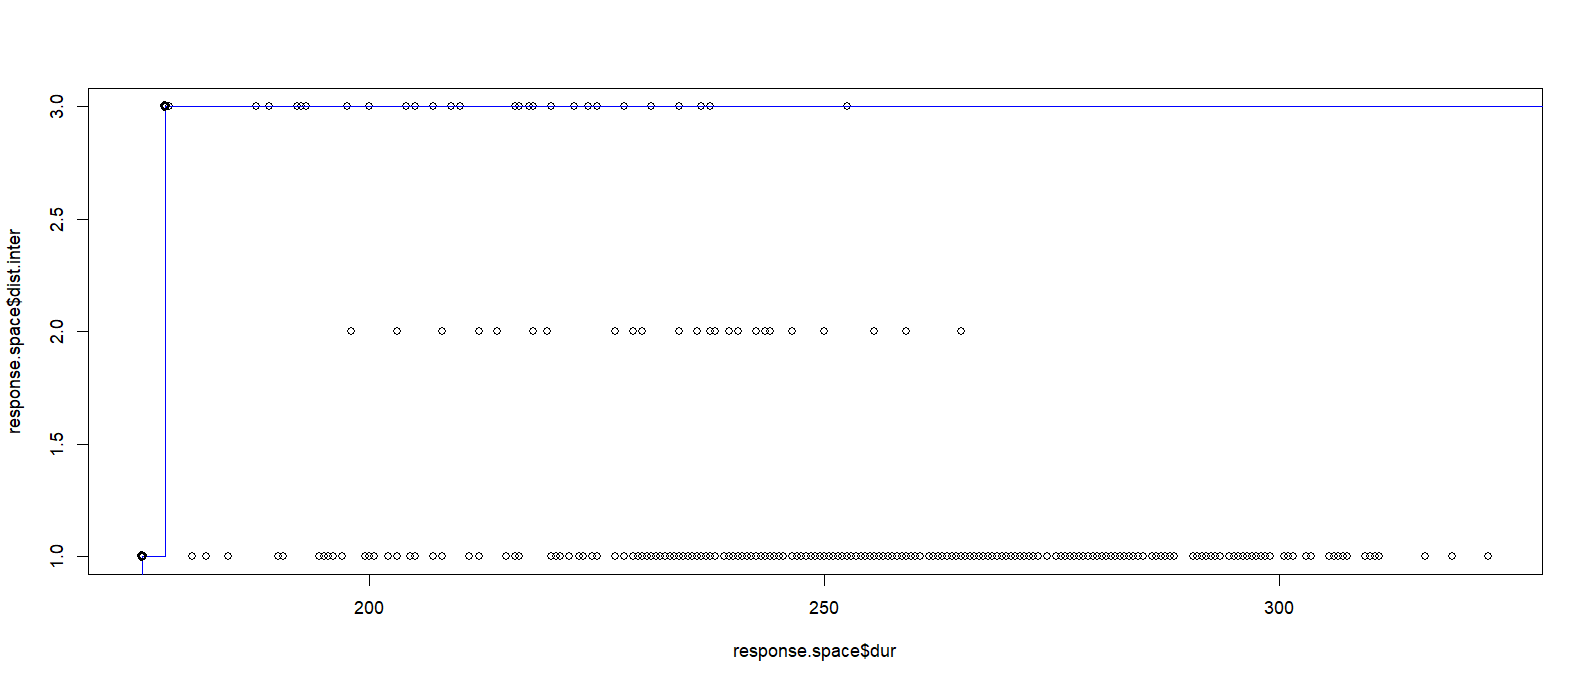
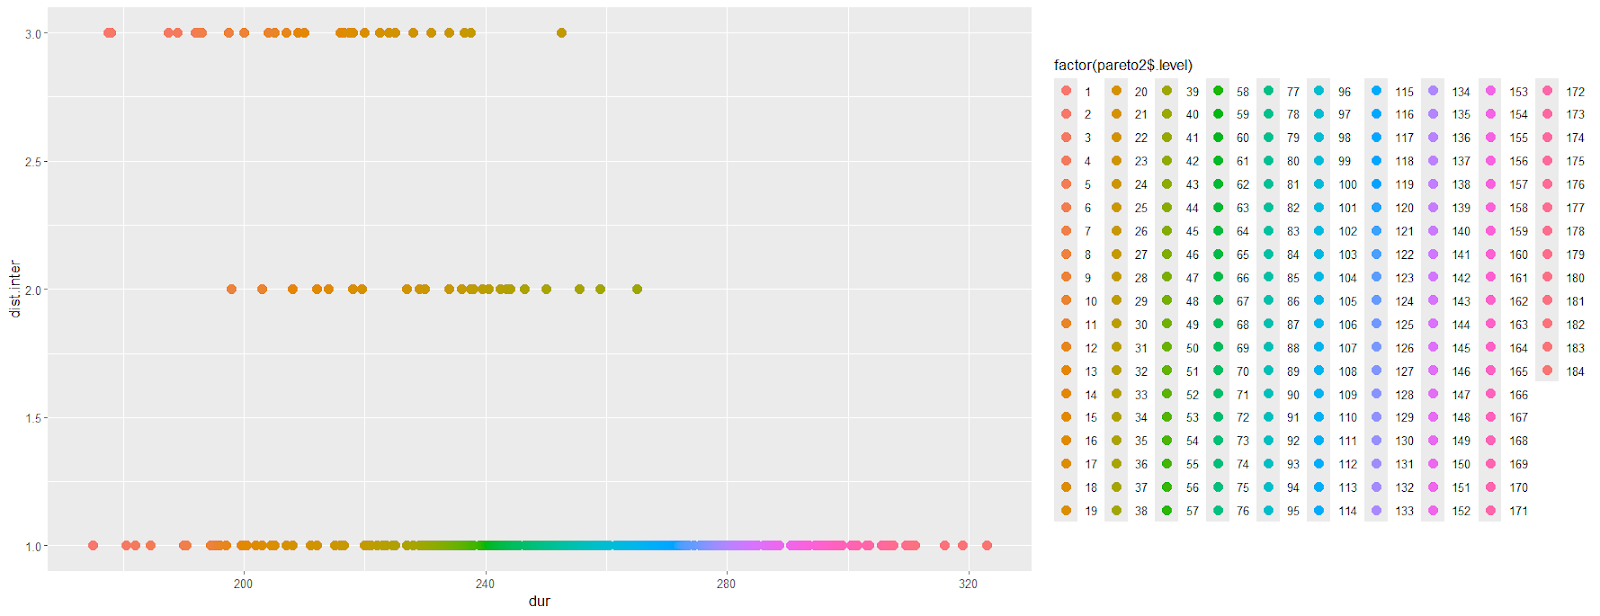
This figure shows the design exploration results used to identify maintenance timelines where the two railway systems do not overlap.
Each point represents a possible combination of maintenance timing between the two railway systems.
The selected point indicates the solution where maintenance events are fully separated in time, ensuring that both railway tracks are never closed simultaneously.
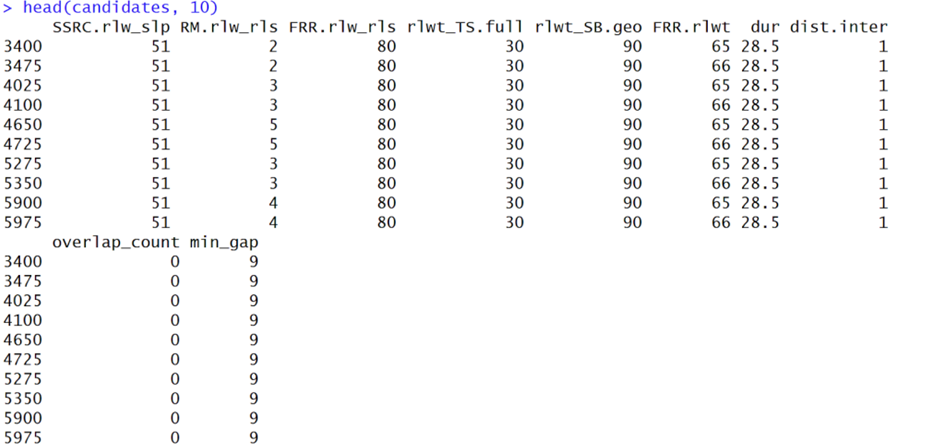
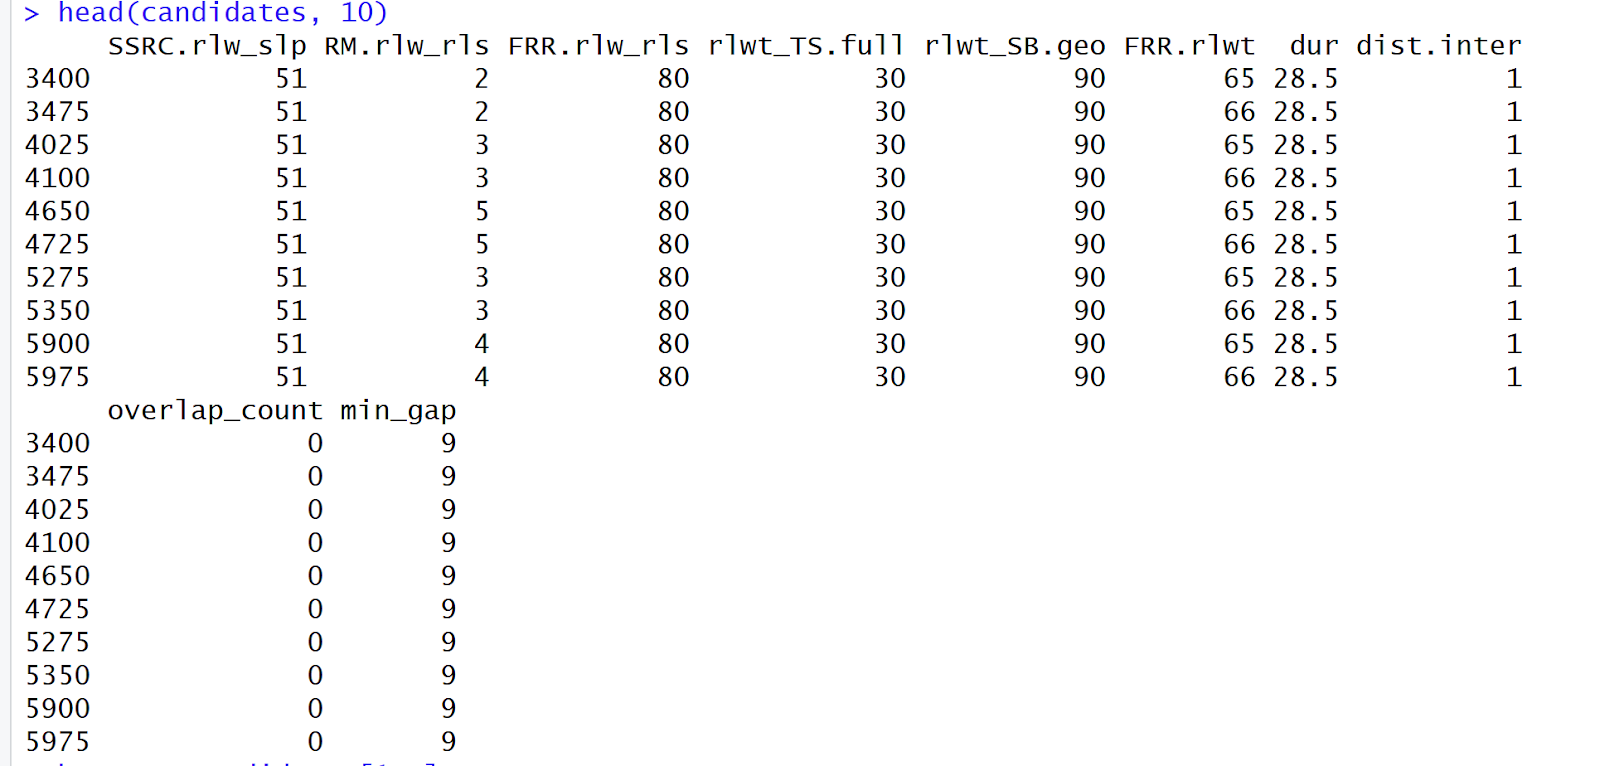
This table shows the optimised maintenance schedule candidates for the two railway systems.All selected solutions have an overlap count of 0, meaning that maintenance events between the two railway systems do not occur at the same time.This table shows the optimised maintenance schedule candidates for the two railway systems.All selected solutions have an overlap count of 0, meaning that maintenance events between the two railway systems do not occur at the same time.
| Systems | EventCode | Intervention | Lower Range of Best Frequency (years) | Upper Rangeof Best Frequency (years) | Total Duration (days) |
| Railway Track Concrete sleepers | SSRC.rlw_slp | Systematic sleeper renewal campaign | 51 | 51 | 28.5 |
| FRR.rlw_rls | Full Rail Renewal | 80 | 80 | ||
| Railway Track Timber sleepers | rlwt_TS.full | Full sleeper renewal | 30 | 30 | |
| rlwt_SB.geo | Geotextile full replacement | 90 | 90 | ||
| FRR.rlwt | Full Rail Renewal | 65 | 66 |
The total maintenance duration was originally 23.25 days, but after applying the optimisation constraints (zero overlap and minimum gap requirements), the final selected duration increased to 28.5 days.
Strategy 2- Railways Grouped with the Nearest System
Goal
The objective of this strategy is to facilitate single-track working by grouping each railway track with its respective passenger access system. This ensures that maintenance activities affecting both access and track operations are coordinated and executed simultaneously. By aligning these interventions, the station avoids redundant closures, while the staggered scheduling derived in Strategy 1 ensures that the adjacent track remains operational.
Approach
The maintenance schedules established in Strategy 1 serve as the foundation for this approach, maintaining the requirement that the two tracks are serviced at different times. Each railway system is paired with the specific infrastructure that provides its access: the timber sleeper track is grouped with the steel truss bridge, and the concrete sleeper track is grouped with the station building.
For the timber railway and concrete railway components, the frequencies used are the “Best Frequency” results obtained from the initial Strategy 1 optimisation. Conversely, the frequencies for the steel truss bridge and the reinforced concrete building are taken directly from original maintenance data without additional optimisation. This allows for a clear evaluation of how existing structural maintenance needs integrate with optimised railway schedules.
Strategy 2-1 Railway Track Timber sleepers and Steel Truss Bridge
Because the timber sleeper track is reached exclusively via the footbridge, coupling bridge maintenance with timber railway interventions prevents the track from being inaccessible by a bridge closure. Before optimisation, this combined grouping accounted for 129.25 days of interruptions over the 120-year lifecycle. Following the alignment of bridge member replacement and recoating with the track’s best frequencies, the total duration is significantly reduced.


The original maintenance strategy has 5 different intervention types and in total 129.25 days of interruptions for a total lifetime of 120 years. This interruption duration is calculated with the standard frequencies.
| Systems | EventCode | Intervention | Lower Rangeof Best Frequency (years) | Upper Range of Best Frequency (years) | Duration (days) |
| Railway Track Timber sleepers | rlwt_TS.full | Full sleeper renewal | 30 | 30 | 1 |
| rlwt_SB.geo | Geotextile full replacement | 90 | 90 | 14 | |
| FRR.rlwt | Full Rail Renewal | 65 | 66 | 1.25 | |
| Systems | EventCode | Intervention | Lower Range Frequency (years) | Upper Range Frequency (years) | Duration (days) |
| Steel Truss Bridge | MP.stb | Member Replacement | 10 | 20 | 7 |
| FR.stb | Full Recoating | 20 | 30 | 21 |
This table presents the optimised maintenance schedule for the timber sleeper railway system and the steel truss bridge. The selected schedule represents the minimum feasible maintenance duration of 66.25 days, as the optimisation prioritises minimising total downtime rather than maximising the maintenance gap.
| Systems | EventCode | Intervention | Best Frequency (years) | Total Duration (days) |
| Railway Track Timber sleepers | rlwt_TS.full | Full sleeper renewal | 30 | 66.25 |
| rlwt_SB.geo | Geotextile full replacement | 90 | ||
| FRR.rlwt | Full Rail Renewal | 66 | ||
| Steel Truss Bridge | MP.stb | Member Replacement | 20 | |
| FR.stb | Full Recoating | 20 |
The total maintenance duration was originally 129.25 days, but after applying the optimisation constraints, the final selected duration decreased to 66.25 days.
Strategy 2-2 Railway Track Concrete sleepers and Building Reinforced
The concrete sleeper track is accessed directly through the station building. Consequently, building maintenance is coupled with the concrete railway’s optimised maintenance cycle. Originally, this strategy involved 7 different intervention types totalling 138 days of interruptions. By synchronising these structural tasks with the primary rail renewals, the downtime is consolidated into fewer, more efficient operational windows.


The original maintenance strategy has 7 different intervention types and in total 138 days of interruptions for a total lifetime of 120 years. This interruption duration is calculated with the standard frequencies.
Strategy 3- Grouped Façade Maintenance
Goal
To reduce on-site manpower requirements and overall maintenance costs by coordinating both façade systems, recognising that façade maintenance does not require closure of the station building and does not interrupt railway operations. By grouping façade interventions, the number of times contractors need to come to the site is reduced, which should lower overall maintenance costs. This strategy therefore focuses on minimising repeated access requirements and user disruption, rather than maintaining system availability, since façade maintenance does not cause system disruption.
Approach
The two façade systems are treated as a single maintenance group, and their interventions are scheduled concurrently wherever possible.


The original second maintenance strategy has 6 different intervention types and in total 135 days of interruptions for a total lifetime of 120 years. This interruption duration is calculated with the standard frequencies.
| Systems | EventCode | Intervention | Lower Range Frequency (years) | Upper Range Frequency (years) | Duration (days) |
| Precast Concrete Facade | CR.pcf | Coating Refresh | 12 | 18 | 3 |
| JM.pcf | Joint Maintenance | 15 | 25 | 5 | |
| PR.pcf | Panel Replacement | 40 | 60 | 10 | |
| Glass Curtain Wall | DC.gcw | deep cleaning | 5 | 10 | 3 |
| GR.gcw | gasket replacement | 8 | 14 | 5 | |
| IR.gcw | IGU replacement | 40 | 60 | 14 |
This table presents the optimised maintenance schedule for the Two Facade Systems. The selected schedule represents the minimum feasible maintenance duration of 53 days, as the optimisation prioritises minimising total downtime rather than maximising the maintenance gap.
| Systems | EventCode | Intervention | Best Frequency (years) | Total Duration (days) |
| Precast Concrete Facade | CR.pcf | Coating Refresh | 18 | 53 |
| JM.pcf | Joint Maintenance | 18 | ||
| PR.pcf | Panel Replacement | 60 | ||
| Glass Curtain Wall | DC.gcw | deep cleaning | 9 | |
| GR.gcw | gasket replacement | 9 | ||
| IR.gcw | IGU replacement | 60 |
The total maintenance duration was originally 135 days, but after applying the optimisation constraints, the final selected duration decreased to 53 days.
Strategy 4- Bridge and Building Grouped
Goal
Similar to the grouping of the façades, an alternative maintenance strategy is to coordinate the maintenance of both the bridge and the station building. By grouping these activities, the total system shutdown time can be reduced, because when both systems are closed, the entire station must close due to a lack of access to the rail. This approach also reduces cost, as the contractors required for bridge and building maintenance are likely similar, meaning the number of site call-outs can be reduced.
Approach
Bridge and building maintenance activities are scheduled together within a shared maintenance timeline.

The original second maintenance strategy has 6 different intervention types and in total 295 days of interruptions for a total lifetime of 120 years. This interruption duration is calculated with the standard frequencies.
| Systems | EventCode | Intervention | Lower Range Frequency (years) | Upper Range Frequency (years) | Duration (days) |
| Steel Truss Bridge | MP.stb | Member Replacement | 10 | 20 | 7 |
| FR.stb | Full Recoating | 20 | 30 | 21 | |
| Building Reinforced | SR.brcs | Spall Repair | 5 | 70 | 21 |
| CS/JR.brcs | Crack Sealing / Joints Refurbishment | 20 | 30 | 7 | |
| CT.brcp | Carbonation Treatment | 15 | 25 | 5 | |
| SG.brcf | Structural Grounding | 30 | 50 | 41 |
This table presents the optimised maintenance schedule for the Steel Truss Bridge and Building Reinforced. The selected schedule represents the minimum feasible maintenance duration of 172 days, as the optimisation prioritises minimising total downtime rather than maximising the maintenance gap.
| Systems | EventCode | Intervention | Best Frequency (years) | Total Duration (days) |
| Steel Truss Bridge | MP.stb | Member Replacement | 20 | 172 |
| FR.stb | Full Recoating | 20 | ||
| Building Reinforced | SR.brcs | Spall Repair | 50 | |
| CS/JR.brcs | Crack Sealing / Joints Refurbishment | 20 | ||
| CT.brcp | Carbonation Treatment | 20 | ||
| SG.brcf | Structural Grounding | 40 |
The total maintenance duration was originally 295 days, but after applying the optimisation constraints, the final selected duration decreased to 172 days.
However, This strategy was not adopted in the final maintenance plan. Although these systems show positive relationships, it is weaker and less operationally critical compared to the railway access system relationships defined in Strategy 2. This strategy did not provide sufficient benefit to justify the potential risks to system downtime.
Best Timeline
| Systems | EventCode | Intervention | Best Frequency (years) |
| Precast Concrete Facade | CR.pcf | Coating Refresh | 18 |
| JM.pcf | Joint Maintenance | 18 | |
| PR.pcf | Panel Replacement | 60 | |
| Glass Curtain Wall | DC.gcw | deep cleaning | 9 |
| GR.gcw | gasket replacement | 9 | |
| IR.gcw | IGU replacement | 60 | |
| Steel Truss Bridge | MP.stb | Member Replacement | 20 |
| FR.stb | Full Recoating | 20 | |
| Building Reinforced | SR.brcs | Spall Repair | 50 |
| CS/JR.brcs | Crack Sealing / Joints Refurbishment | 20 | |
| CT.brcp | Carbonation Treatment | 20 | |
| SG.brcf | Structural Grounding | 40 | |
| Railway Track Concrete sleepers | SSRC.rlw_slp | Systematic sleeper renewal campaign | 51 |
| RM.rlw_rls | Rail milling | 5 | |
| FRR.rlw_rls | Full Rail Renewal | 80 | |
| Railway Track Timber sleepers | rlwt_TS.full | Full sleeper renewal | 30 |
| rlwt_SB.geo | Geotextile full replacement | 90 | |
| FRR.rlwt | Full Rail Renewal | 66 |
Conclusion
By evaluating the four proposed maintenance strategies against the 120 year lifecycle of the station, a final Best Timeline has been developed. This integrated approach combines the strengths of Strategies 1, 2, and 3, while intentionally omitting Strategy 4. The integrated maintenance timeline was developed based on system relationships and operational constraints.
The two railway systems are scheduled to avoid overlapping maintenance periods, while maintenance events within each individual railway system are aligned where possible. This approach minimises downtime at the system level while ensuring that both railway tracks are not closed simultaneously, thereby maintaining overall system availability. While the staggering of events ensures the station remains functional, it naturally extends the cumulative duration of individual track closures over the lifecycle. This result demonstrates that to maintain the seven day railway objective, a slight increase in total work days is a necessary trade off to ensure that passengers always have access to at least one operational railway.
The optimised railway timelines were aligned, where feasible, with systems that have positive relationships. This includes coordinating the timber railway with the bridge system and the concrete railway with the building system. This alignment maximises simultaneous maintenance opportunities and reduces the frequency of access-related shutdowns.
Both façade systems were scheduled to overlap with each other. As façade maintenance has no direct operational dependency on railway or access systems, these interventions were grouped independently. This reduces repeated site access and maintenance effort without impacting the operational status of the rail network.
The strategy of grouping the building and bridge systems together was not adopted. Although these systems show some positive relationships, it is weaker and less operationally critical compared to the railway access system relationships defined in Strategy 2. This grouping did not provide sufficient benefit to justify the potential risks to system downtime.
During the analysis, only positive and negative relationships were used to define scheduling constraints. Positive relationships allow for simultaneous maintenance, while negative relationships require temporal separation. Except for the dual railway constraint, all other integrations aim to minimise overall downtime by coordinating compatible maintenance events.