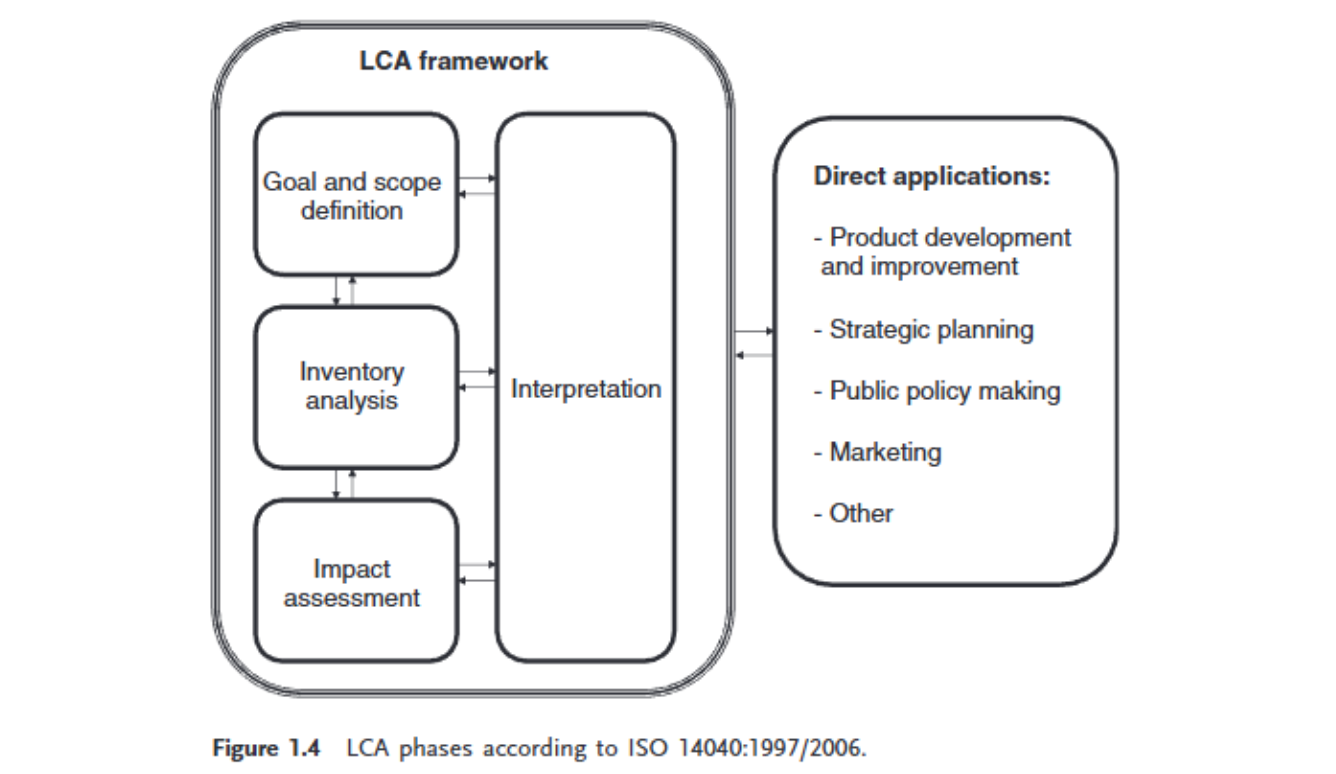
Life Cycle Assessment (LCA) is conducted following the four phases defined in ISO 14040/14044 which are Goals and Scope Definition, Life Cycle Inventory (LCI), Life Cycle Impact Assessment (LCIA) and Interpretation (Klöpffer & Grahl, 2014, Fig. 1.4).
5.1. Scope and Goal
The main goal of this study is to evaluate and compare the environmental impact of this the corridor integration with a particular focus on carbon footprints and total costs associated with each environmental factor.
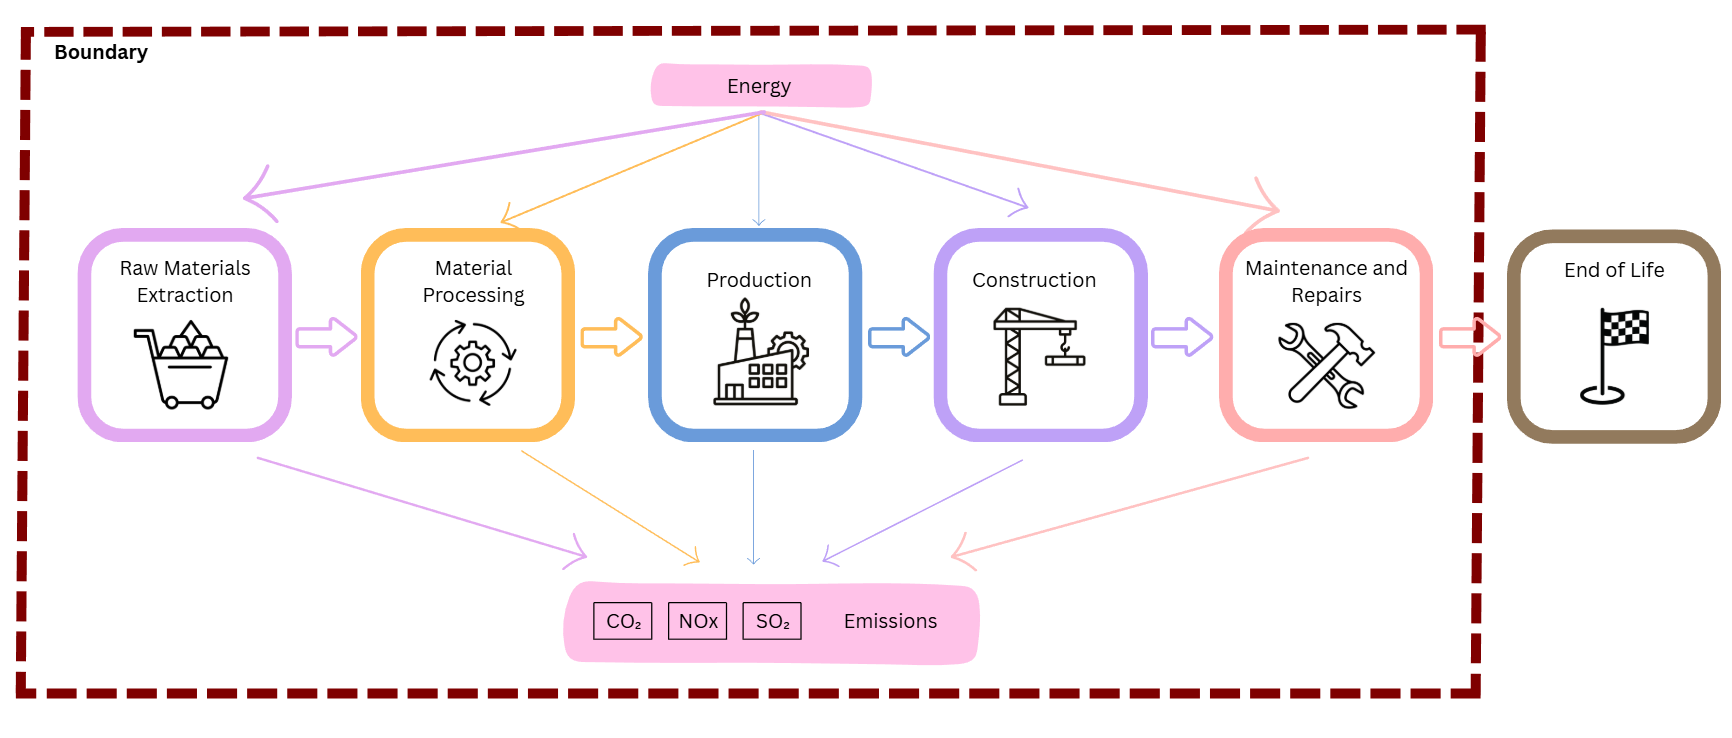
The scope and boundary is limited to raw materials extraction, material processing, production, construction and maintenance and repairs.
5.2. Life Cycle Inventory
The table summarizes the Life Cycle Inventory (LCI) for each system presenting material alternatives along with their associated environmental impact factors and costs per functional unit. The environmental indicators include cumulative energy demand (BMWSB, n.d.), CO₂ (BMWSB, n.d.), NOₓ and SO₂ emissions. These values provide the basis for comparing material options and for subsequent life cycle impact and cost assessments.
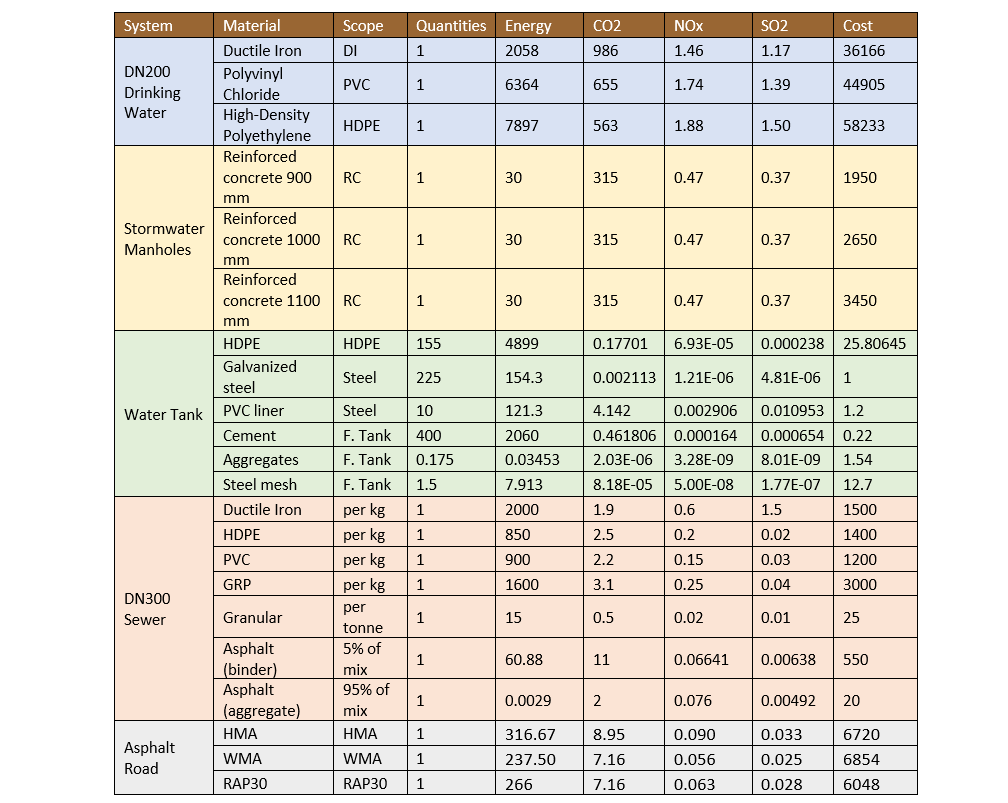
The quantities were defined based on representative functional units for each system. For the road, DN200 and DN300, a quantity of 1 corresponds to a pipe length of 100 m which is consistent with the integrated corridor length. Meanwhile the stormwater manhole quantity represents a single manhole unit and the overall tank quantity for each material were counted in individual assignment as above. The water tank quantities were kept constant across all scenarios and therefore do not influence the comparative results of the corridor-based analysis.
All environmental and cost indicators in the LCI table are reported using consistent volume-based units. Energy demand is expressed in MJ per tonne, CO₂, NOₓ and SO₂ emissions are reported in kg/m³ and cost is given in € following Germany currency.
Maintenance, repair and replacement processes occurring during the service life of the corridor systems were modelled using a simplified intervention-weighting approach as ÖKOBAUDAT does not provide material-specific environmental factors for the processes. For non-pipe system components, intervention frequencies were translated into percentage-based material usage for maintenance and repair based on engineering judgement and standard civil engineering service-life expectations enabling consistent integration of maintenance impacts despite data limitations. This is different from the DN200 pipe where each intervention associated with an assumed fraction of material involvement rather than full system renewal.
For buried sewer systems, maintenance modelling explicitly includes excavation and backfill materials associated with repair and replacement activities. Incorporating backfill significantly influences material demand and environmental impacts and therefore provides a more realistic representation of maintenance-related processes compared to pipe-only modelling approaches.
5.3. Life Cycle Impact Assessment (LCIA)
5.3.1. Systems Geometry
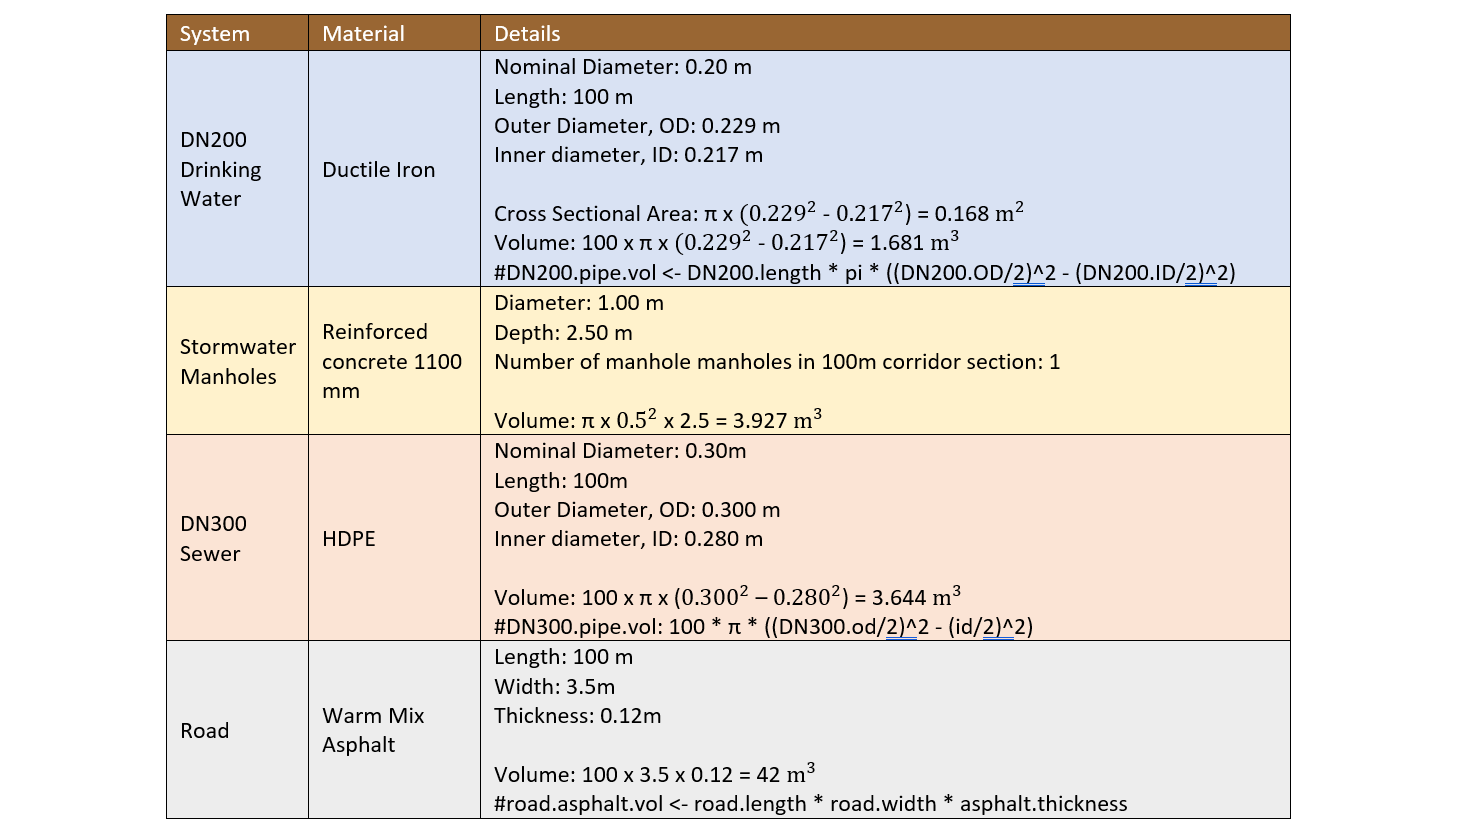
Table below presents the volume used in this tutorial for different elements under analysis. The cross sectional area of each system is multiplied with 100m length of the integrated corridor to get the volume for each system.
5.3.2. Cost Analysis prefer table or graphs
Energy, CO₂, NOₓ and SO₂ prices were applied as economic proxy values to monetize environmental impacts rather than as material purchase prices.

Energy costs represent average delivered energy prices and were used to monetize cumulative energy demand meanwhile CO₂ costs were defined using representative carbon pricing benchmarks to reflect the economic valuation of greenhouse gas emissions. In contrast, NOₓ and SO₂ costs were modelled as external damage costs expressed in €/kg emitted, representing monetized health and environmental impacts based on established European air-pollution impact assessment literature. All pricing factors were applied to volume-based inventory results (per m³) to ensure consistency across systems.
Energy costs were estimated using average German electricity prices as reported by Eurostat which is 26 €/MJ in 2022 (Eurostat, n.d.). Meanwhile the cost for CO2 was taken from carbon price in Germany in 2022 which is 33 USD and when converted it is 26€/kg (World Bank, 2022, Figure 6). Assumption has been made for NOx and SO2 based on the previous tutorial.
5.4. Analysis Result and Interpretation
The total life-cycle energy use and emissions of the integrated corridor system were quantified using R or a 75-year analysis period covering raw material extraction, material processing, production, construction and maintenance and repair activities. The results indicate a cumulative energy demand of 204,718 MJ, accompanied by emissions of 6,123 kg CO₂, 60.94 kg NOₓ, and 21.95 kg SO₂.

In addition to environmental indicators, the total direct life-cycle system cost amounts to approximately 4.27 million €. This value represents engineering and infrastructure costs including material production, construction activities and maintenance interventions over the system lifetime. It reflects the actual economic expenditure required to deliver and maintain the integrated corridor system.
Carbon dioxide exhibits the highest absolute emission mass among the environmental indicators. This is primarily driven by energy-intensive material production processes and repeated maintenance activities throughout the life cycle. NOₓ and SO₂ emissions occur in much smaller quantities as they are linked to specific combustion and processing stages rather than bulk material volumes.
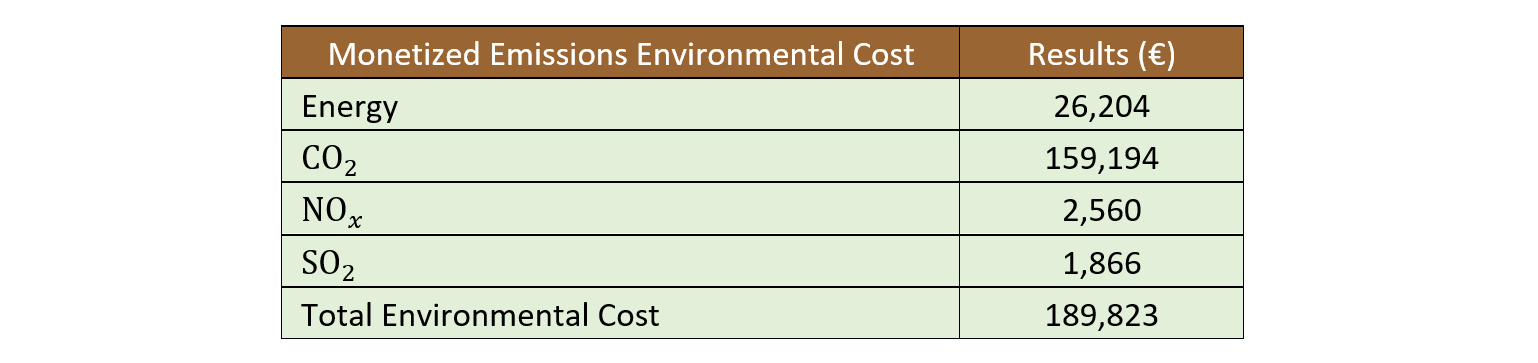
When emissions are monetized, a different perspective emerges. The total monetized environmental cost amounts to approximately 189,823 € which is two orders of magnitude smaller than the direct system cost. CO₂ contributes the largest share of this environmental cost which is 159,194 € not because it has the highest damage cost per unit mass but because its emission volume is significantly higher than that of NOₓ and SO₂. In contrast, NOₓ and SO₂ have much higher damage costs per kilogram due to their severe health and ecological impacts. However, their overall contribution remains lower because their emitted quantities are comparatively small.
A similar distinction applies to energy use. Although cumulative energy demand is the largest physical indicator, its monetized cost of 26,204 € is relatively low compared to emission-related costs. This reflects the low unit price of energy relative to the external damage costs associated with air-pollutant emissions. As a result, high energy consumption does not directly dominate the environmental cost whereas pollutants with high damage factors can have a disproportionate economic impact.
From an engineering perspective, the results clearly demonstrate that direct life-cycle system costs dominate the overall economic picture while environmental external costs, although smaller in magnitude remain significant and non-negligible. Even with environmentally conscious integration strategies, long-term maintenance activities and material-intensive components drive both high construction costs and accumulated environmental impacts. Therefore, sustainable system design cannot rely solely on reducing emissions or energy use but must also address material efficiency, maintenance frequency and system integration strategies to balance economic feasibility with environmental performance.
5.5. References
Klöpffer, W., & Grahl, B. (2014). Life cycle assessment (LCA): A guide to best practice. Weinheim, Germany: Wiley-VCH.
Bundesministerium für Wohnen, Stadtentwicklung und Bauwesen (BMWSB) (n.d.). ÖKOBAUDAT – Database for Environmental Product Declarations. Available at: https://www.oekobaudat.de/no_cache/datenbank/suche.html (Accessed: 3 February 2026).
Eurostat (n.d.). Electricity prices for household consumers – annual data (nrg_pc_205_c). European Commission. Available at:
https://ec.europa.eu/eurostat/databrowser/view/nrg_pc_205_c/default/table?lang=en (Accessed: 3 February 2026).
World Bank (2022). State and Trends of Carbon Pricing 2022. Washington, DC: World Bank. Available at: https://openknowledge.worldbank.org/entities/publication/a1abead2-de91-5992-bb7a-73d8aaaf767f/full (Accessed: 3 February 2026).
< Integrated Maintenance————— Multi-Objective Optimization >