The integrated parametric models combine all individual civil engineering subsystems into a single, demand-driven analytical framework to evaluate system performance and resilience in a consistent and comparable manner. The purpose of integration is to explicitly capture the interdependence between building water demand, water supply, storage, distribution networks, and road-based emergency delivery, allowing infrastructure investments to be assessed against service availability under multiple operating conditions (Davis & Lambert, 2002; Trifunović, 2020).
At the core of the integrated model is the definition of building water demand as the primary system driver. Demand is derived from building geometry and number of storeys and represents the functional requirement that all supporting systems must satisfy. Water treatment capacity, elevated storage volume, pipe conveyance, and emergency trucking capacity are all parameterized as functions of this demand. This ensures that changes in population or building scale propagate coherently through the entire system, maintaining internal consistency across design alternatives (Noy & McGuinness, 2001).
Design Challenge
The design challenge addressed by the integrated parametric models is to evaluate how different levels of infrastructure investment translate into resilience outcomes under increasing demand and varying disruption scenarios. Rather than optimizing individual subsystems in isolation, the model assesses whether balanced investment across supply, storage, distribution, and access infrastructure results in improved service continuity during emergencies.
High Performance Criteria
System performance is evaluated using two complementary metrics:
- Total water supply capacity (Q), expressed in m³/day, which quantifies the maximum volume of water that can be delivered to the building under a given operating mode.
- Resilience, measured through days of autonomy and service ratio. Days of autonomy represent the duration for which demand can be met using on‑site storage alone, while the service ratio expresses the fraction of demand satisfied over a defined time horizon. A service ratio of 1 indicates full demand satisfaction under the specified disruption condition (Davis & Lambert, 2002).
Together, these metrics capture both the magnitude of available supply and the temporal reliability of service under stress conditions.
Service Modes
The integrated model evaluates system behavior across three service modes that represent progressively severe disruption scenarios:
- Normal Operation – Water treatment supply and the pipe network fully satisfy building demand, while elevated storage remains in reserve. This mode reflects standard operating conditions in which all primary infrastructure components are functional.
- Disruption – A failure in the primary supply network triggers reliance on elevated storage. The tank supplies demand for a finite duration, after which emergency water trucking supplements the system via the road network. This mode captures partial infrastructure failure and the transition between primary and backup systems.
- Extreme Disruption – Complete loss of pipe‑based supply results in trucking as the sole delivery mechanism. This mode represents worst‑case conditions where redundancy is limited to road accessibility and external water delivery capacity.
The combined performance across these modes is expressed through service ratios that reflect the cumulative contribution of supply, storage, and trucking to meeting demand over the analysis horizon (CPHEEO, 2013).
Table 1. Resilience performance across service modes for population growth alternatives
| Performance metric | Alt A (Low) | Alt B (Medium) | Alt C (High) |
| Mode 1 – Normal Operation | |||
| Total supply capacity, Q (m³/day) | 62.13 | 121.6 | 192 |
| Service ratio (–) | 1.00 | 1.00 | 1.00 |
| Mode 2 – Disruption (Tank → Truck) | |||
| Tank autonomy before trucking (days) | 2.95 | 5.71 | 9.95 |
| Supply after switch to trucking (m³/day) | 40 | 80 | 120 |
| Service ratio after switch (–) | 0.88 | 0.71 | 0.66 |
| Service ratio over 7-day horizon (–) | 0.94 | 0.95 | 1.00 |
| Analysis horizon (days) | 7 | 7 | 7 |
| Mode 3 – Extreme Disruption (Truck Only) | |||
| Truck supply capacity (m³/day) | 40 | 80 | 120 |
| Service ratio (–) | 0.88 | 0.71 | 0.67 |
Population Growth Alternatives
Three population growth alternatives, low, medium, and high are modeled by increasing building height and corresponding daily water demand. As demand increases, treatment capacity and pipe conveyance are scaled to remain sufficient under normal conditions. Elevated storage volume and road capacity are increased proportionally to support longer autonomy and higher emergency delivery rates. This correlated growth reflects realistic infrastructure planning practices where supporting systems must expand alongside demand (Trifunović, 2020).
Table 2. Parametric values for population growth alternatives
| Parameter | Low Growth | Medium Growth | High Growth |
| Building height (number of storeys) | 2 | 5 | 8 |
| Building water demand (m³/day) | 45 | 112.5 | 180 |
| Elevated tank diameter (m) | 8 | 14 | 20 |
| Elevated tank height (m) | 3 | 4.5 | 6 |
| Water supply structure height (m) | 2 | 2.5 | 2.75 |
| Water supply structure diameter (m) | 2 | 2.5 | 3 |
| Pipe nominal diameter (DN) | DN150 | DN150 | DN150 |
| Road lanes per direction (number) | 1 | 2 | 3 |
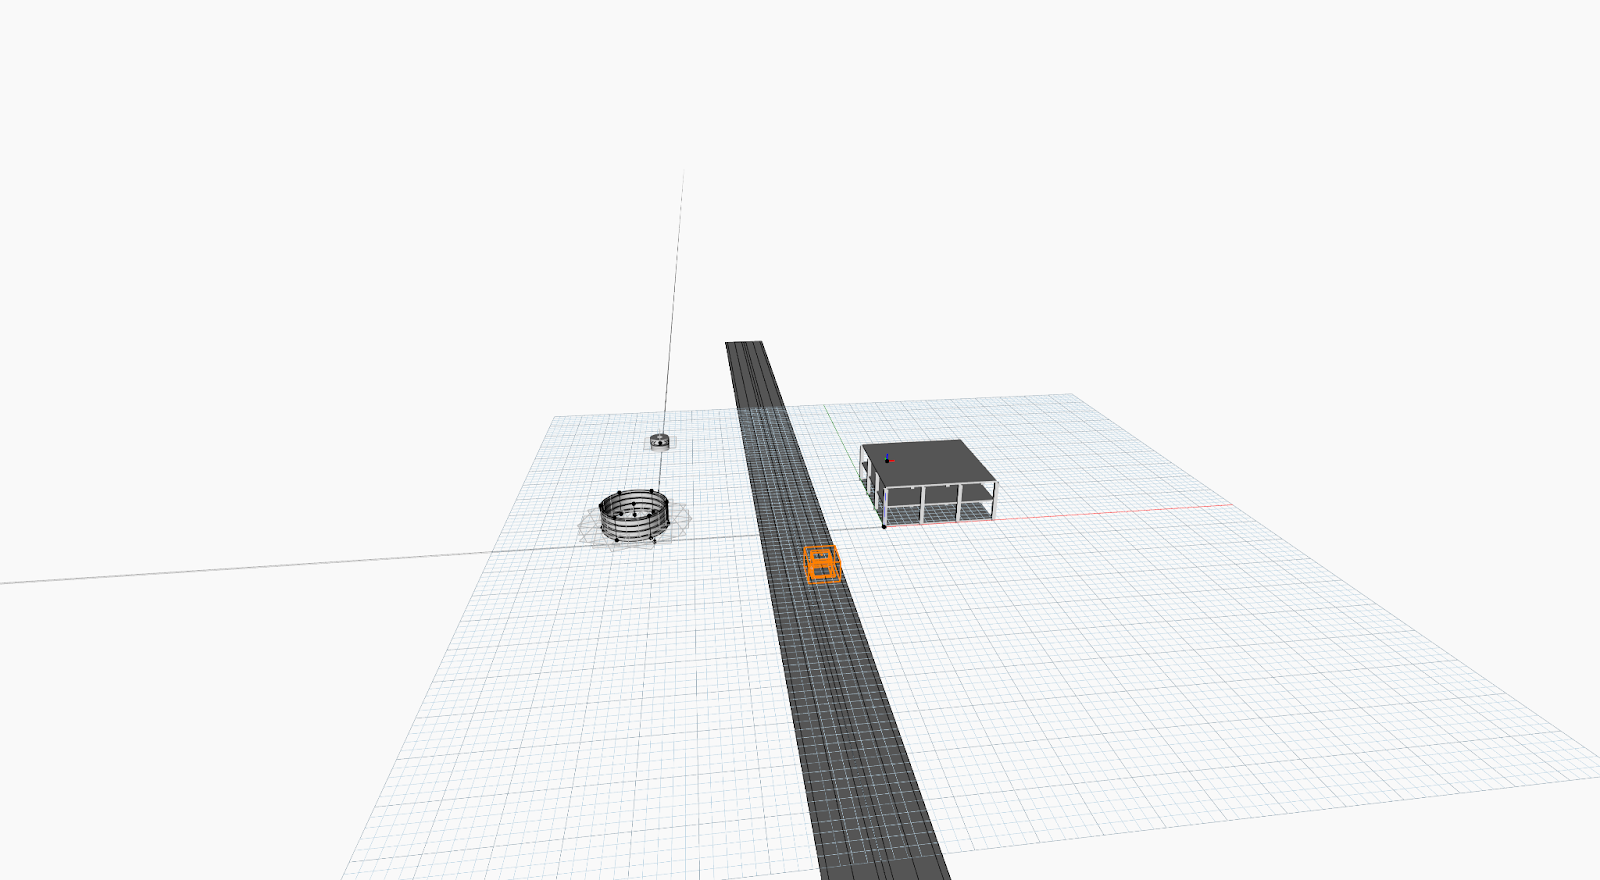
Figure 1: A Low population grown model with low investment in infrastructure.
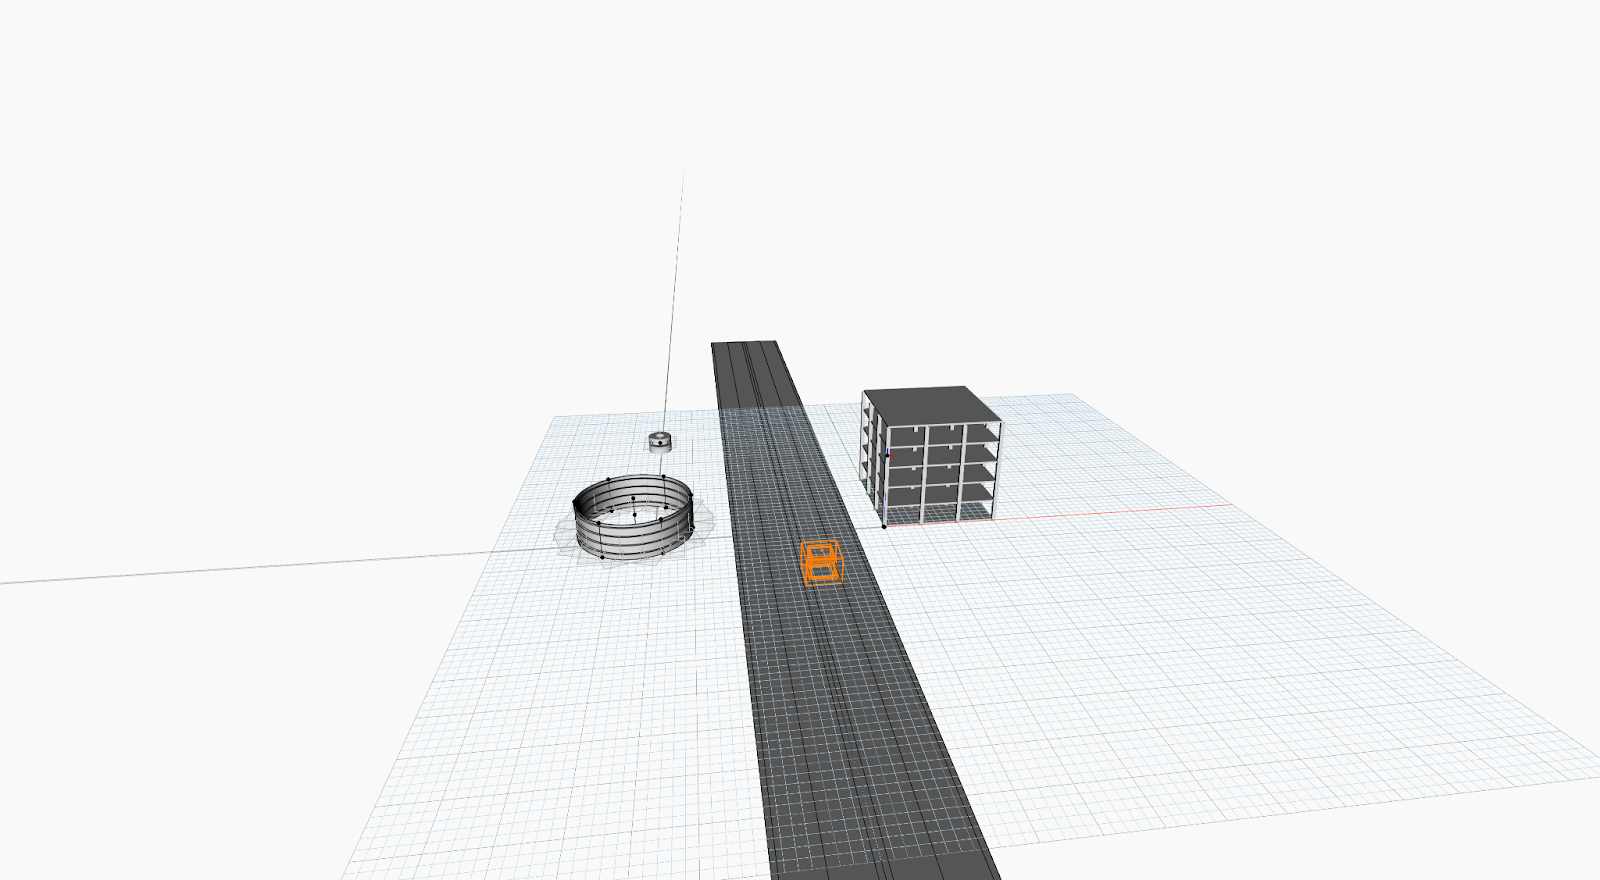
Figure 2: Medium population grown model with medium investment in infrastructure.
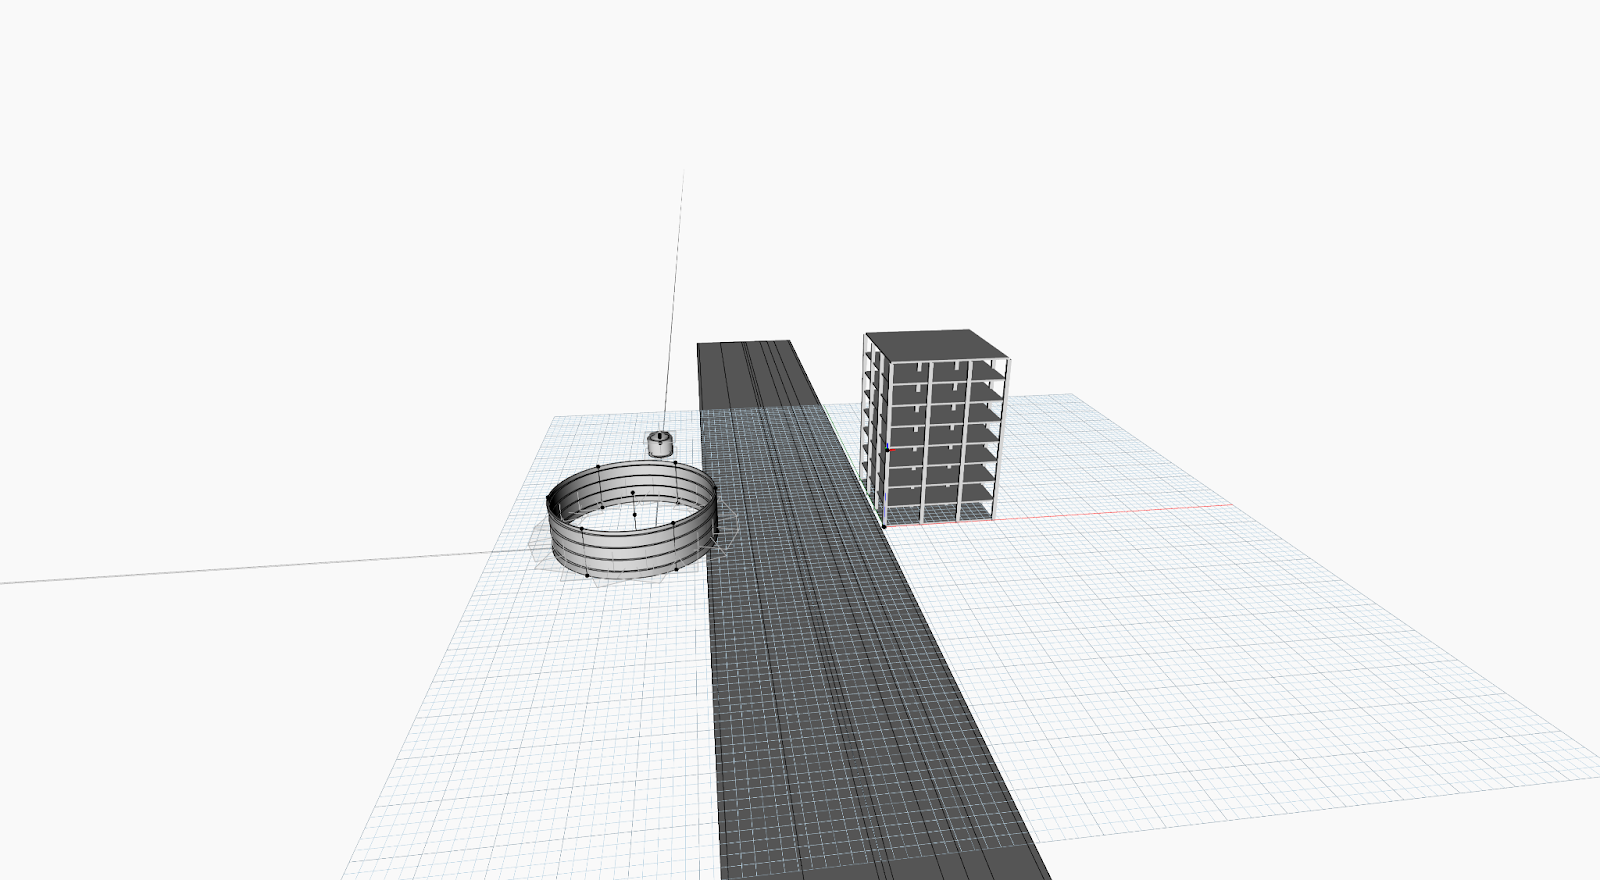
Figure 3: High population grown model with high investment in infrastructure.
Discussion
Results from the integrated model demonstrate that system resilience is strongly influenced by coordinated investment across subsystems rather than by maximizing any single component. Higher growth scenarios achieve longer durations of uninterrupted service during disruption due to increased elevated storage capacity, indicating that storage provides a robust buffer against short‑term failures. However, even at high investment levels, road‑based emergency trucking exhibits diminishing returns, highlighting physical and operational constraints associated with vehicle‑based water delivery (Mehdian et al., 2022).
While storage scales effectively with demand, treatment and distribution infrastructure must be carefully matched to avoid persistent bottlenecks under normal operation. Emergency trucking should therefore be treated as a short‑term contingency rather than a primary resilience strategy. The integrated results confirm that resilient emergency water supply systems emerge from balanced, demand‑responsive investments that explicitly account for interactions between buildings, hydraulic infrastructure, storage, and access networks.
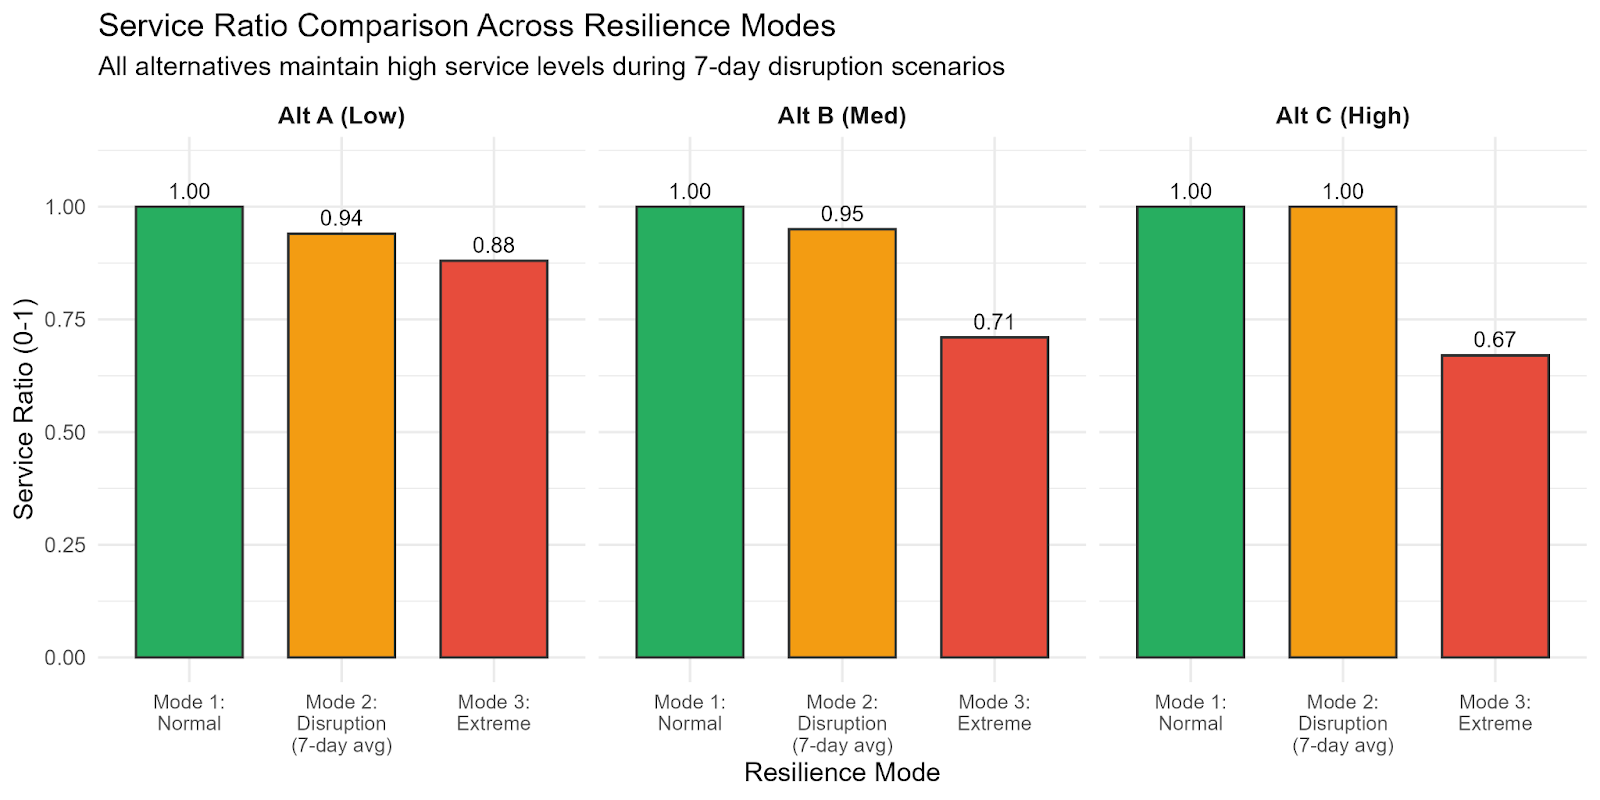
Figure 4: Resiliency of Infrastructure at three growths, at three service modes. Service Ratio indicates the performance of each
Conclusion
The integrated parametric modeling approach demonstrates the value of a demand‑driven, system‑of‑systems perspective for evaluating emergency water supply resilience at the building scale. By linking building demand to supply, storage, distribution, and road‑based delivery within a unified framework, the model enables transparent comparison of design alternatives and realistic assessment of service continuity under disruption. The findings show that elevated storage provides the greatest resilience benefit by extending autonomy and stabilizing service, while emergency trucking plays a limited but necessary role under extreme conditions. Overall, the study confirms that effective resilience is achieved through integrated and proportionate infrastructure investment rather than through isolated optimization of individual subsystems.
References
- ACI Committee 318. (2019). Building code requirements for structural concrete (ACI 318‑19). American Concrete Institute.
- Central Public Health and Environmental Engineering Organisation. (2013). Manual on water supply and treatment. Ministry of Urban Development, Government of India.
- Davis, J., & Lambert, R. (2002). Engineering in emergencies: A practical guide for relief workers (2nd ed.). Intermediate Technology Publications.
- Mehdian, M., Mirzahossein, H., & Abdi Kordani, A. (2022). A data‑driven functional classification of urban roadways based on geometric design, traffic characteristics, and land‑use features. Journal of Advanced Transportation, Article ID 4.
- Noy, N. F., & McGuinness, D. L. (2001). Ontology development 101: A guide to creating your first ontology. Stanford University.
- Trifunović, N. (2020). Introduction to urban water distribution: Theory. CRC Press.
Home | Introduction | Individual systems | Integration Context | Integrated Ontology | Integrated Parametric Model | Conclusion