Introduction
Recent research highlights the ecological impacts of gravity-based wind turbine foundations on marine environments. These large, material-intensive structures generate significant emissions during production and installation, making their environmental assessment important in the context of the low-carbon transition and sustainable engineering decision-making.
Engineering Aspects
Goal and Scope of the Assessment
In this study, a GBF with a design lifespan of 25 years is defined as the functional unit.
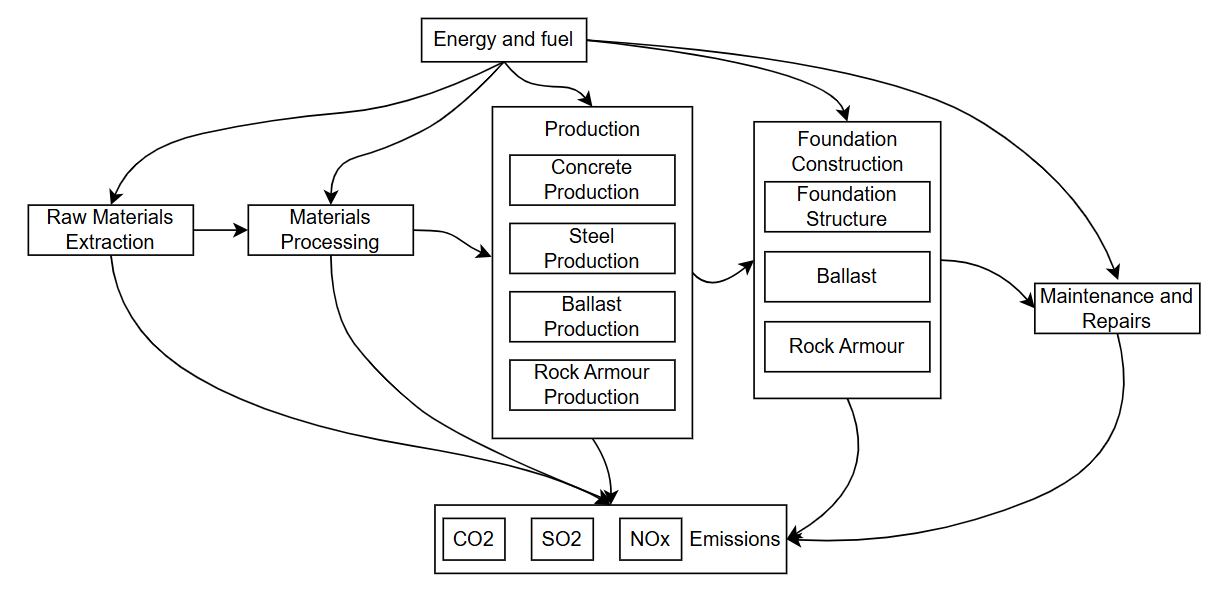
Fig.1 LCA boundaries
Design Options
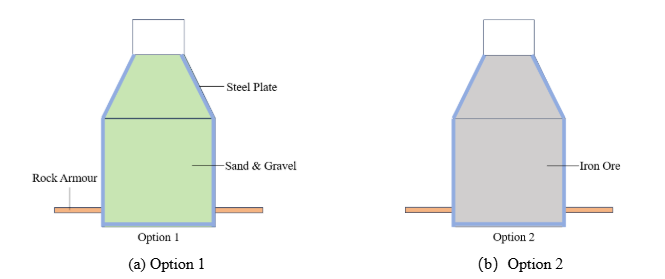
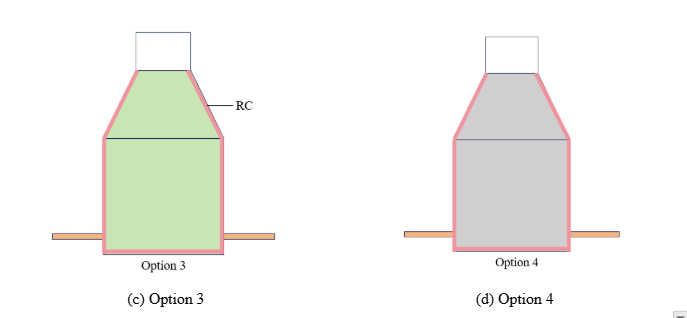
Fig.2 Design Options RC (reinforced concrete)
Table 1 Different design options
| Design Option | Foundation Structure | Ballast | Scour Protection |
| Option 1 | Reinforced Concrete | Sand / Gravel | Rock Armour |
| Option 2 | Steel | Iron Ore | Rock Armour |
| Option 3 | Reinforced Concrete | Iron Ore | Rock Armour |
| Option 3 | Steel | Sand / Gravel | Rock Armour |
Table 2 Material characteristic
| Element | Material | Description |
| Concrete Caisson (Wall Thickness = 0.8m) [2] | 50MPa, High-Performance Marine Concrete | High-durability concrete suitable for marine environments |
| Sand Ballast (1.8t/m3) [3] | Sand / Gravel, Dense Graded | Low-cost ballast materials are commonly used in gravity-based foundations |
| Scour Protection (Annular Layer) (2.5t/m3) [4] | Rock Armour, 0.5-1.0 tonne | Granite/basalt for scour protection around the foundation |
| Steel Skirt & Compartments (Plate Thickness = 0.018m)(7.85t/m3)[5] | S355G8+M, High-Strength Marine Steel | High-strength steel specifically designed for marine engineering applications |
| Iron Ore Ballast(2t/m3) [6] | Iron Ore, High-Density Aggregate | Utilized to improve the foundation’s dead weight and overall sliding stability. |
Life Cycle Inventory of Different Materials, Performance, and Environmental Indicators
Table 3 Life cycle inventory data
| Material | Scope | Quantities(kg) | Energy (MJ/kg) | CO2 (kg) | NOx (kg) | SO2 (kg) |
| Cement | CC | 180 | 3.50 | 0.75 | 0.18 | 0.06 |
| Fly Ash | CC | 60 | 0 | 0.002 | 0 | 0.75 |
| GGBS | CC | 220 | 0.40 | 0.04 | 0.01 | 0.02 |
| Coarse Aggregates | CC | 1127 | 0.0040 | 0.016 | 0.0018 | 0.0018 |
| Fine Aggregates | CC | 831 | 0.0025 | 0.0055 | 0.0090 | 0.0090 |
| Reinforcement Steel | CC | 140 | 2450 | 235 | 0.72 | 1.90 |
| Steel Plate | SS | 1 | 2450 | 235 | 0.72 | 1.90 |
| Iron Ore | BI | 1 | 0.5 | 0.03 | 0.002 | 0.002 |
| Sand/Gravel | BS | 1 | 0.1 | 0.01 | 0.0004 | 0.0005 |
| Rock Armour | SP | 1 | 0.2 | 0.02 | 0.001 | 0.001 |
Caisson Concrete (CC), Steel Skirt (SS), Ballast(B), Scour Protection (SP)
Life-Cycle Timeline
Table 4 Intervention schedule
| DesignOption | Event | Frequency | TotalLifespan |
| Reinforced Concrete and Sand Ballast | RI | 0.5 | 25 |
| Reinforced Concrete and Sand Ballast | MM | 5 | 25 |
| Reinforced Concrete and Sand Ballast | ScourR | 10 | 25 |
| Reinforced Concrete and Sand Ballast | CR | 15 | 25 |
| Steel and Iron Ore Ballast | RI | 0.5 | 25 |
| Steel and Iron Ore Ballast | MM | 5 | 25 |
| Steel and Iron Ore Ballast | CPM | 2 | 25 |
| Steel and Iron Ore Ballast | ScourR | 10 | 25 |
| Reinforced Concrete and Iron Ore Ballast | RI | 0.5 | 25 |
| Reinforced Concrete and Iron Ore Ballast | MM | 5 | 25 |
| Reinforced Concrete and Iron Ore Ballast | CPM | 2 | 25 |
| Reinforced Concrete and Iron Ore Ballast | ScourR | 10 | 25 |
| Reinforced Concrete and Iron Ore Ballast | CR | 15 | 25 |
| Steel and Sand Ballast | RI | 0.5 | 25 |
| Steel and Sand Ballast | MM | 5 | 25 |
| Steel and Sand Ballast | ScourR | 10 | 25 |
| Steel and Sand Ballast | CPM | 2 | 25 |
Routine Inspection (RI), Minor Maintenance, Scour Replenishment including Ballast Replenishment (ScourR), Concrete Repair (CR), Corrosion Protection Maintenance (CPM)
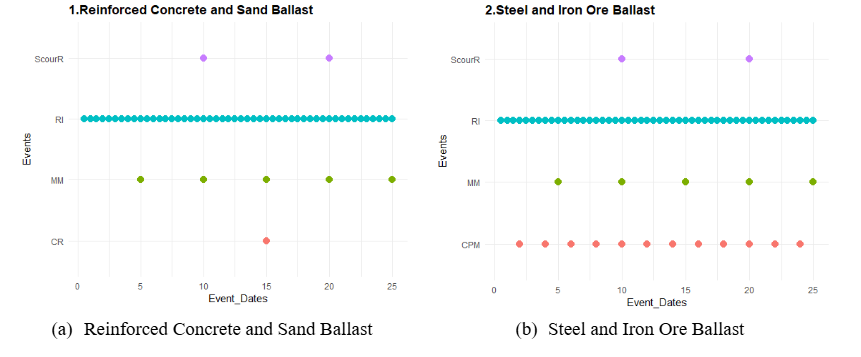
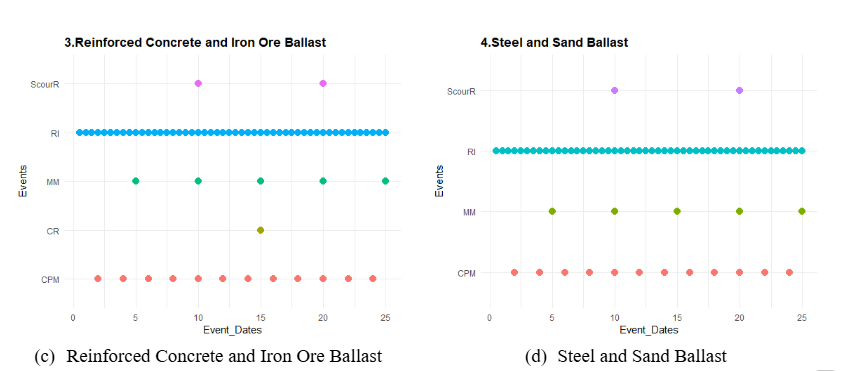
Fig.3 Interventions on a timeline
Life Cycle Inventory and Analysis
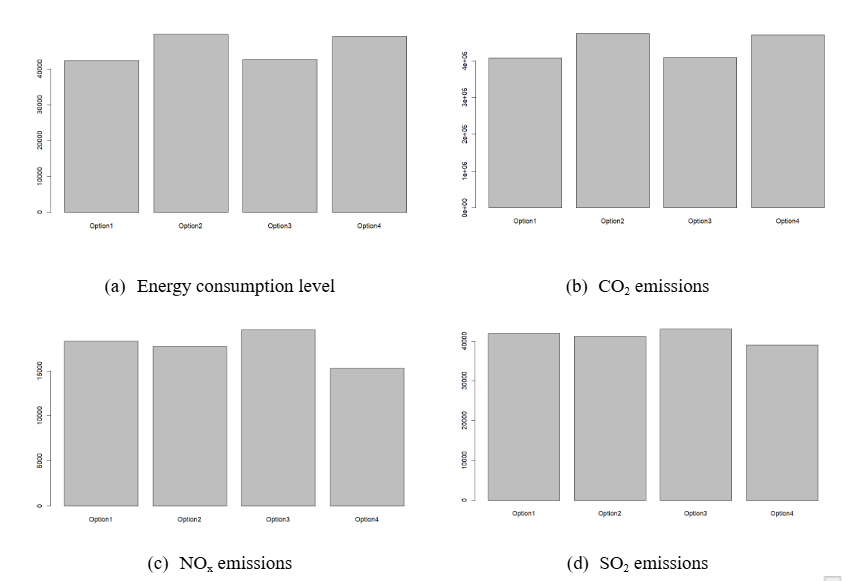
Fig.4 Different levels of energy consumption and emission for the life cycle of design options
As shown in Fig. 4, Options 2 and 4 have the highest energy consumption and CO₂ emissions, while Options 1 and 3 show higher NOx and SO₂ emissions due to their concrete-based structures. Overall, steel structures are characterized by high energy demand but lower chemical emissions, whereas concrete structures exhibit lower energy use but higher pollutant emissions.
Analytic Hierarchy Process (AHP)
From Fig. 5, Option 1 achieves the highest score due to its lowest overall CO₂, NOₓ, and SO₂ emissions. Concrete structures generate lower manufacturing emissions than steel systems, and the use of sand/gravel ballast further reduces life-cycle impacts. Option 2 ranks lowest because of emission-intensive steel production and additional impacts from iron ore extraction and transport. Options 3 and 4 fall in between, with their relative performance driven mainly by differences in ballast material rather than structural form alone.
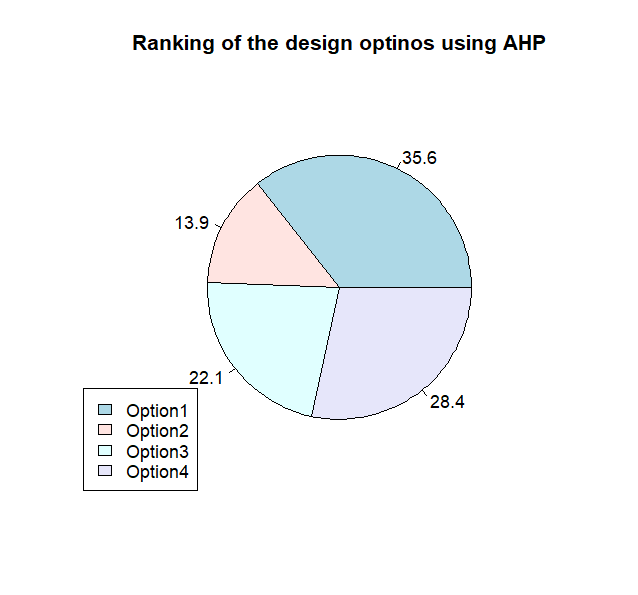
Fig.5 Ranking of the design options using AHP
Discussion and Recommendation Under Different Scenarios
From an engineering perspective, steel structures (Options 2 and 4) offer higher stiffness, better fatigue performance, and improved crack resistance, making them suitable for harsh marine conditions, although these advantages come with higher energy use and emissions from steel production. Concrete structures (Options 1 and 3) exhibit lower manufacturing emissions and can often be sourced locally, reducing transport impacts, but their greater weight can introduce construction and bearing-capacity challenges. Ballast choice is also critical: iron ore significantly increases emissions due to extraction and transport, while sand/gravel remains a more environmentally favorable option.
Overall, the optimal design depends on project priorities. Option 1 is preferred when marine environmental protection is prioritized, Options 1 and 3 perform well for energy and emissions reduction, and Option 4 is recommended when mechanical performance governs the design due to its higher structural capacity and lower impact compared to Option 2.
Limitations
This study assumes that GBFs are manufactured in coastal heavy-duty ports or converted dry docks. As such, the resulting emission data are region-specific. If the material supply chain were altered, the final environmental outcomes could differ accordingly.
Reference
[1] Doney, S. C., Fabry, V. J., Feely, R. A., & Kleypas, J. A. (2009). Ocean acidification: the other CO2 problem. Annual review of marine science, 1(1), 169-192.
[2] DNV GL. (2019). Support structures for wind turbines (Standard No. DNVGL-ST-0126). DNV GL.
[3] Das, B. M., & Sivakugan, N. (2017). Fundamentals of geotechnical engineering. Cengage Learning.
[4] DNV AS. (2024, May). DNV-ST-0437: Loads and site conditions for wind turbines [Standard].
[5] Goodno, B. J., & Gere, J. M. (2020). Mechanics of Materials, Enhanced Edition (9th ed.). Cengage Learning.
[6] Carr, D. D. (Ed.). (1994). Industrial minerals and rocks (6th ed.). Society for Mining, Metallurgy, and Exploration.
[7] Anderson, J., & Moncaster, A. (2020). Embodied carbon of concrete in buildings, Part 1: analysis of published EPD. Buildings & Cities, 1(1).
[8] McGrath, T., Nanukuttan, S., Basheer, P. A. M., Long, A., Owens, K., & Doherty, W. (2012, September). Embodied energy and carbon footprinting of concrete production and use. In Proceedings of the 3rd International Conference on the Durability of Concrete Structures, ICDCS (Vol. 2012).
[9] Matthes, W., Vollpracht, A., Villagrán, Y., Kamali-Bernard, S., Hooton, D., Gruyaert, E., … & De Belie, N. (2017). Ground granulated blast-furnace slag. In Properties of Fresh and Hardened Concrete Containing Supplementary Cementitious Materials: State-of-the-Art Report of the RILEM Technical Committee 238-SCM, Working Group 4 (pp. 1-53). Cham: Springer International Publishing.
[10] Anh, L. H., Mihai, F. C., Belousova, A., Kucera, R., Oswald, K. D., Riedel, W., … & Schneider, P. (2023). Life cycle assessment of river sand and aggregates alternatives in concrete. Materials, 16(5), 2064.
[11] Olmez, G. M., Dilek, F. B., Karanfil, T., & Yetis, U. (2016). The environmental impacts of iron and steel industry: a life cycle assessment study. Journal of Cleaner Production, 130, 195-201.
[12] Fernandez, R. P., & Pardo, M. L. (2013). Offshore concrete structures. Ocean Engineering, 58, 304-316.
[13] Standard, I. (2006). Environmental management-Life cycle assessment-Requirements and guidelines. London: ISO.
[14] Chen, L. (2023). Research on condition-based maintenance and optimization methods for offshore wind farms [Doctoral dissertation, China University of Petroleum (Beijing)]. (in Chinese)
[15] Maples, B., Saur, G., Hand, M., Van De Pietermen, R., & Obdam, T. (2013). Installation, operation, and maintenance strategies to reduce the cost of offshore wind energy (No. NREL/TP-5000-57403). National Renewable Energy Laboratory (NREL), Golden, CO (United States).
[16] October (2006). HORNS REV 2 OFFSHORE WIND FARM Environmental impact assessment summary of the EIA Report.
[17] Wang, S., Zeng, J., & Fan, Z. (2021). Durability analysis of high-performance concrete for marine engineering based on long-term exposure tests. Journal of Civil Engineering, 54(10), 82–89. (Chinese)
[18] EIB. (2006, October). Horns Rev 2 offshore wind farm – Environmental impact assessment: Summary of the EIA-report. Luxembourg: European Investment Bank.