Service Interruption Minimizing Integrated Maintenance Scenario
Within this strategy, maintenance activities were planned without exceeding the maintenance intervals recommended in literature or commonly accepted in practice. Intervals range set for each system are shown in table 1.a .
| Subsystem | Surface Repair | Major Repair/ Rehabitation | Replacement |
| Gravity Retaining Wall | 10-25 | 65-75 | 35-50 |
| ETICS | 35-50 | – | 60-70 |
| Cantilever Retaining Wall | 10-35 | 25-65 | 45-55 |
| Hardwood Flooring | – | 25-35 | 60-70 |
| Concrete Beam with Hollow Floor Slab | 10-35 | 35-55 | – |
In this context, the expected duration of each maintenance activity was defined as a required input for the subsequent search for optimal integrated maintenance alternatives. Table 1.b summarizes the assumed durations of maintenance activities for each subsystem, indicating how long the system is
affected when a specific intervention is carried out. These values do not define a maintenance strategy
or intervention timing but serve as essential parameters for quantifying service interruptions and comparing alternative maintenance schedules in the optimization stage.
| Subsystem | Surface Repair | Major Repair/ Rehabitation | Replacement |
| Gravity Retaining Wall | 2 | 10 | 5 |
| ETICS | 3 | – | 5 |
| Cantilever Retaining Wall | 3 | 10 | 20 |
| Hardwood Flooring | – | 5 | 25 |
| Concrete Beam with Hollow Floor Slab | 8 | 25 | – |
Evaluating individual system parameters over the defined 100 year service life is relatively straightforward when subsystems are considered in isolation. However, the main challenge addressed in this study lies in coordinating these subsystems within a common maintenance strategy in a way that minimizes overall system disruption while maintaining structural safety.
It should be noted that system level designs consist of interacting subsystems whose individual maintenance decisions can significantly influence the overall system behavior. While each subsystem may follow reasonable maintenance intervals on its own, their combined effects may lead to concentrated disruptions or unintended service interruptions at the system level.
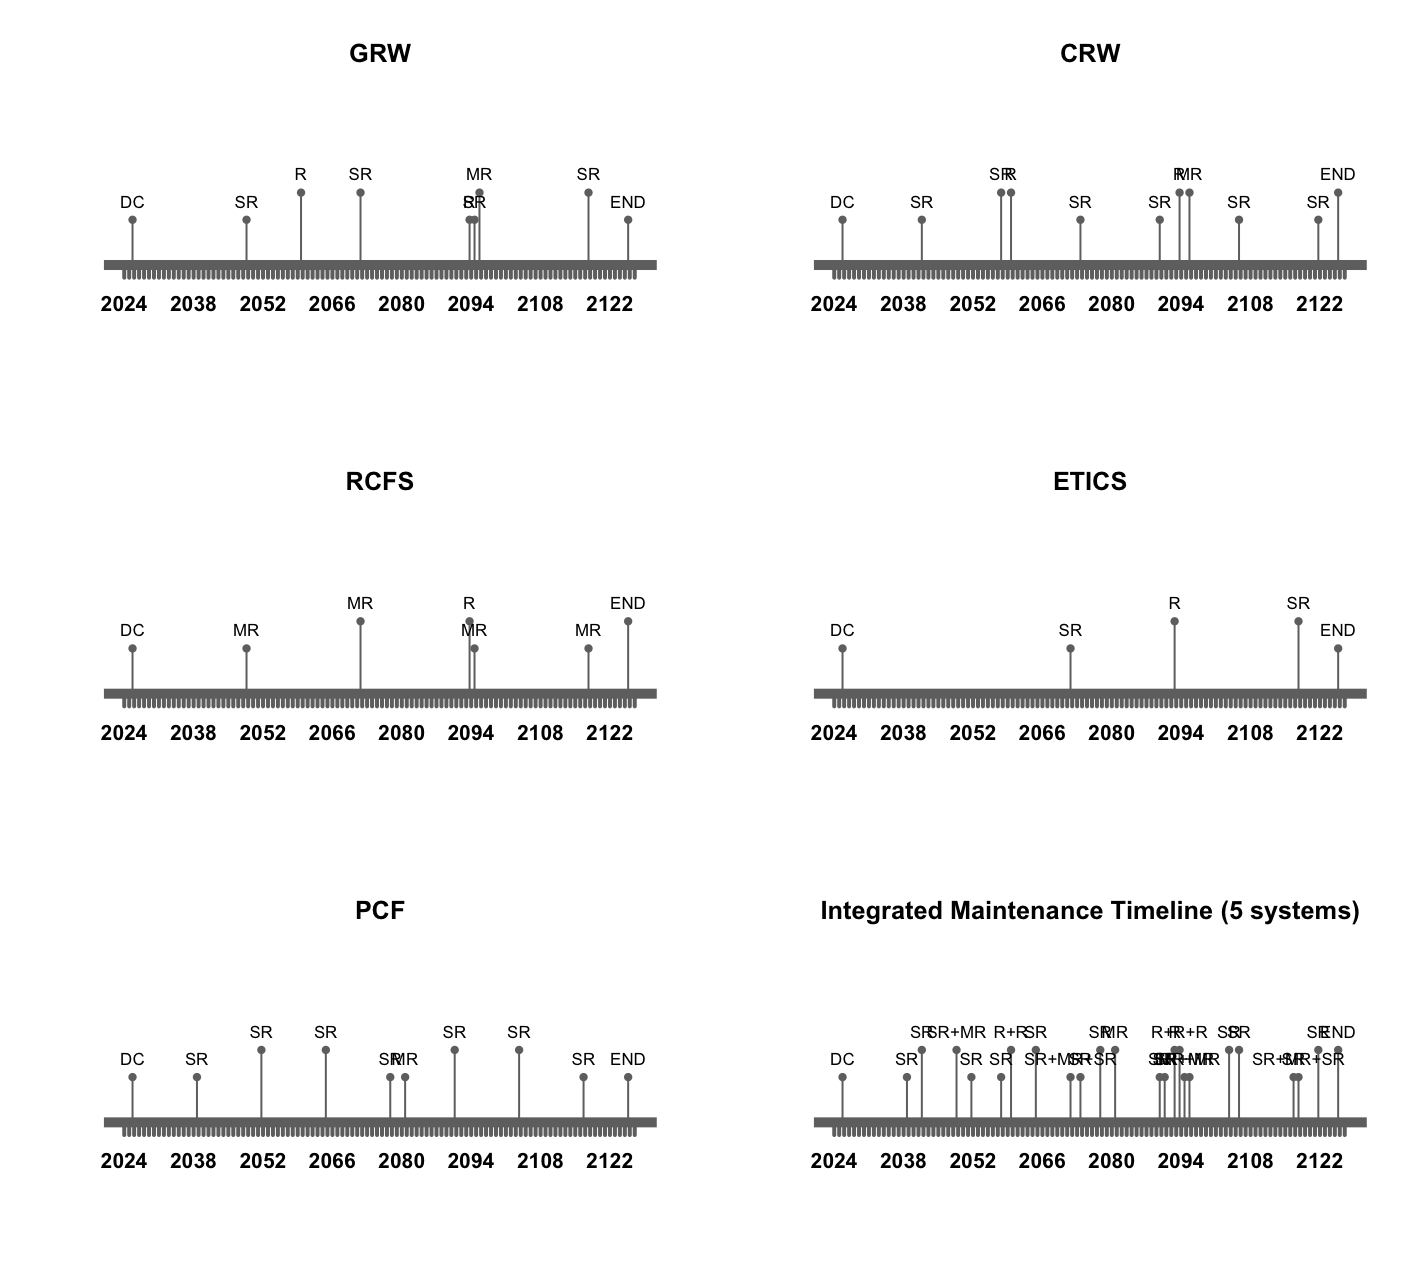
Figure 1.a presents an illustrative integrated maintenance timeline constructed strictly based on the defined maintenance ranges and average intervention frequencies, without applying any optimization. Its purpose is to provide contextual understanding of how maintenance activities may align over time under the proposed strategy. However, this representation alone is not sufficient to assess optimal spacing between interventions or to minimize service interruptions, as numerous alternative schedules exist within the same maintenance boundaries. These alternatives are therefore explored systematically in the subsequent optimization stage.
Home | System Definition | Scenario 1 | Scenario 2 | Scenario 3 | Scenario 4 | Discussion | Appendix