In the context of large-scale infrastructure, LCA is an indispensable tool. Because these assets are designed for extreme longevity -in this case, a 120-year lifespan- decisions made during the initial design and early maintenance phases have massive compounding effects. By applying LCA, we can move beyond “first-cost” thinking and understand the true environmental and economic price of an asset over a century of service. This allows us to optimise maintenance intervals, select resilient materials, and ultimately reduce the long-term footprint of our built environment.
Goal
The primary goal of this Life Cycle Assessment (LCA) is to evaluate the long-term sustainability and economic viability of the optimised maintenance strategy defined in our Maintenance Planning phase. Embodied energy reflects the total energy demand of material production and serves as a proxy for resource intensity and long-term sustainability [1].
CO₂ emissions reflect the primary indicator of climate impact, aligning with international decarbonization objectives such as the UK’s Decarbonising Transport initiative [14]
NOₓ emissions were included as a critical indicator for local air quality and human health, regulated under stringent UK and EU standards.
Cost was incorporated because publicly funded bodies with limited budgets manage most rail networks. As a result, financial constraints are inseparable from environmental and operational considerations in maintenance planning [13]
Scope
The analysis is conducted over a 120-year lifespan, capturing the compounding environmental and economic effects of recurring maintenance cycles on the train station system as defined in the integration context section.
Boundary
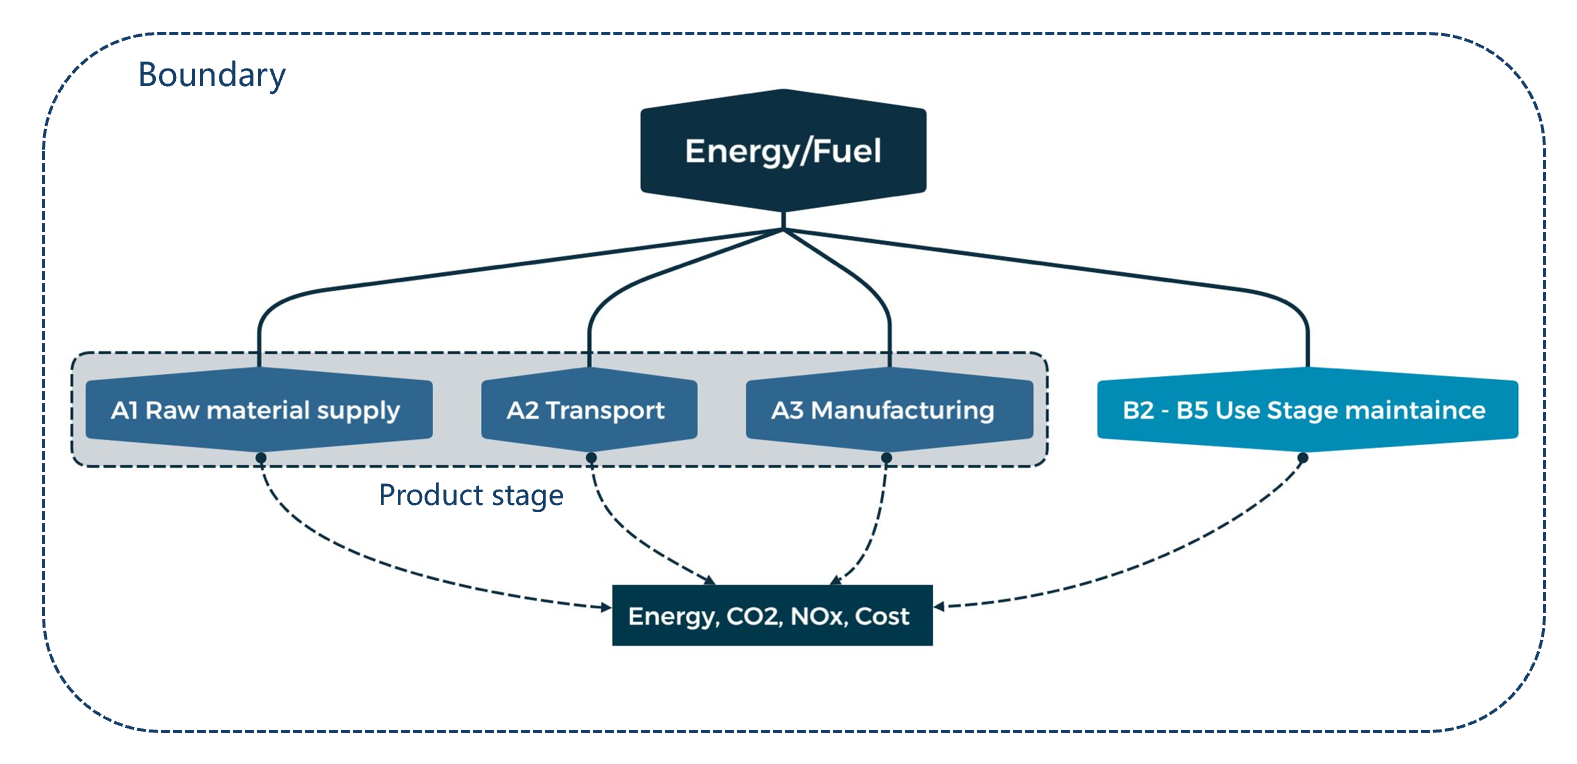
This study adopts a cradle-to-gate boundary, incorporating maintenance impacts derived from R calculations.
Figure 1, boundary diagram This boundary was selected to maintain a high level of data integrity for this specific challenge. Transportation, construction logistics, operational energy, and end-of-life processes are highly variable and strongly influenced by external factors such as user behaviour, supply chains, and future policy conditions. To avoid introducing speculative assumptions, these stages were excluded, ensuring that the results reflect documented industrial manufacturing data rather than uncertain logistical estimates. Focusing on material production and maintenance-related impacts enables the analysis to isolate the direct consequences of maintenance scheduling decisions. This controlled system boundary allows consistent comparison between alternative strategies and highlights the influence of maintenance planning on long-term environmental and economic performance.
Maintenance LCI Table
Table 1 outlines the life cycle inventory for materials used across our maintenance events. Because our infrastructure assets vary in type, material quantities are scaled to the specific functional unit of each intervention (detailed in the “Units” column).
Embodied energy, emissions (CO2 and NOx), and costs are calculated as impact factors per kilogram (kg). This standardised approach allows for direct material comparisons. Zinc-vinyl coating is evaluated per m² to reflect it’s functional unit.
All costs are ex-works, representing factory-gate prices in Germany. This excludes shipping, handling, and installation.
| Material | Quantity | Unit | Energy (MJ/kg) | CO2 (kg/kg) | NOx (kg/kg) | Cost (€/kg) |
|---|---|---|---|---|---|---|
| Reinforced concrete | 506.25 [2] | kg/m² | 1.095 [2] | 0.187 [2] | 0.0298 [6] | 0.258 [7] |
| EPS insulation | 20 [3] | kg/m² | 89 [3] | 2.8 [3] | 0.009 [6] | 4.09 [8] |
| TiO2 coating | 0.3 [4] | kg/m² | 93 [4] | 7.5 [4] | 0.001 [6] | 47.3 [4/7] |
| Sealant | 0.08 [5] | kg/m | 85 [5] | 4.2 [5] | 0.005 [6] | 12.9 [8] |
| Aluminium | 42.3 [20/22] | kg/m² | 3.3 [20/22] | 0.11 [20/22] | 0.00026 [20/22] | 3 [25] |
| IGU / Float Glass | 30 [20/23] | kg/m² | 7.5 [20/23] | 1.45 [20/23] | 0.0003 [20/23] | 2.1 [26] |
| EPDM Gasket | 0.3 [20] | kg/m² | 0.2 [20] | 0.08 [20] | 0.0004 [20] | 6.2 [27] |
| Cleaning agent | 0.05 [20/21] | kg/m² | 5 [20/21] | 1.8 [20/21] | 0.004 [20/21] | 2.5 [26] |
| High-Strength Repair Mortar | 5.87 | kg/m² | 99.5 [1] | 4.65 [15/16] | 0.0045 [Ivy M.] | 16 [1] |
| Polyurethane (PU) Sealant | 0.12 | kg/m | 85 [17] | 3.2 [17] | 0.0025 [Ivy M.] | 8 [17] |
| Anti-Carbonation | 3 | kg/pillar | 60 [16] | 2.5 [16] | 0.0021 [Ivy M.] | 10 [16] |
| High-Strength Cement Grout | 30.7 | kg/slab | 5 [1] | 0.9 [18] | 0.0016 [Ivy M.] | 1.2 [1] |
| Steel S355 | 64380 | kg/bridge | 30 [28] | 2.01 [28] | 0.003 [Ivy M.] | 1 [29] |
| Zinc-vinyl coating* | 450 | m²/bridge | 18.9* [30] | 1.6* [30] | 0.0037* [30] | 24.7* [31] |
| Concrete | 260 | kg/sleeper | 1.1 [33] | 0.13 [32] | 0.0003 [6] | 0.258 [7] |
| Steel | 60.21 | kg/m | 33.5 [34] | 2.5 [35] | 0.00066 [28] | 0.66 [37] |
| Timber sleeper – Oak | 750 | kg/m³ | 10.4 [1] | 0.87 [1] | 0.00015 [6] | 1.85 [9] |
| Timber – Wood preservative | 60 | kg/m³ | 51 [1] | 0.43 [1] | 0.0045 [6] | 2.28 [11] |
| Polypropylene geotextile | 0.45 | kg/m² | 95.4 [1] | 4.98 [1] | 0.0038 [6] | 1.033 [12] |
*Note: For Zinc-vinyl, emissions are measured per m², not per kg.
Maintenance Inventory and Material Quantities
The material quantities for each maintenance event were derived from a combination of literature review and structural estimations.
- Precast Concrete Façade (PCF): Based on a 400 m² assumed surface. Maintenance events (Coating, Joints, Panels) assume a 30% intervention rate of the total area.[2]
- Glass Curtain Wall (GCW): Based on a 400m² assumed surface. Deep cleaning covers the full area 100%, while gaskets and glass units (IGU) assume a 30% replacement rate. [20]
- Building Reinforced Concrete Slab (BRCS): Calculated for a total area of 840m² (3 x 280m² floors).
- Steel Truss Bridge (STB): Based on a 25m span. Individual member replacement accounts for 6% [39] of the structural chords Full Recoating entails the surface treatment of all structural members [31].
- Railway Tracks (RLWC & RLWT): Calculations are based on the 1 km track length. The sleeper spacing for timber sleepers is 0.685m [40] with each timber sleeper is assumed to have a volume of approximately 0.085 m³ [42]. The sleeper spacing for concrete is 0.6m. The geotextile layer is assumed to be 3m wide along the whole km length [41].
| System | Event code | Event description | Material | Amount per event | Unit |
| PCF | CR.pcf | Coating Refresh | TiO2 coating | 120 [2] | m² |
| PCF | JM.pcf | Joint Maintenance | Sealant | 120 [2] | m² |
| PCF | PR.pcf | Panel Replacement | Full panel LCI | 120 [2] | m² |
| GCW | DC.gcw | deep cleaning | cleaning agent | 400 | m² |
| GCW | GR.gcw | Gasket replacement | EPDM Gasket | 120 | m² |
| GCW | IR.gcw | IGU replacement | Full IGU panel LCI | 80 | m² |
| BRC | SR.brcs | Spall Repair | High-Strength Repair Mortar/ Corrosion Inhibitor | 1413 | m² |
| BRC | CSJR.brcs | Crack Sealing / Joints Refurbishment | Polyurethane (PU) Sealant | 705 | m |
| BRC | CT.brcp | Carbonation Treatment | Anri-Carboantion | 30 | pillars |
| BRC | SG.brcf | Structural Grounding | High-Strength Cement Grout | 15 | slabs |
| STB | MP.stb | Member Replacement | steel S355 | 0.0625 | bridge |
| STB | FR.stb | Full Recoating | zinc-vinyl coating | 1 | bridge |
| RLWC | SSRC.rlw_slp | Systematic sleeper renewal campaign | Concrete | 1668 | sleepers |
| RLWC | FRR.rlw_rls | Full Rail Renewal | Steel | 2000 | m |
| RLWT | rlwt_TS.full | Full sleeper renewal | Timber sleeper | 125 | m³ |
| RLWT | rlwt_SB.geo | Geotextile full replacement | Polypropylene geotextile | 3000 | m² |
| RLWT | FRR.rlwt | Full Rail Renewal | Steel | 2000 | m |
Analysis Results
A life cycle analysis was conducted on the optimised timeline for maintenance events. The resulting values for energy consumption, CO₂, NOₓ emissions, and costs are presented in figure 2 below.
To calculate the total environmental impact in monetary terms, energy usage and emissions were converted into costs using established conversion rates: 0.128 €/MJ for Energy [44], 26 €/kg for CO₂ [43], and 42 €/kg for NOₓ [45]. This method allows for a unified comparison of disparate environmental burdens alongside traditional economic data.
The analysis resulted in a total lifecycle cost of €3,191,061. This figure represents the integrated cost of both material production and environmental externalities over the 120 year analysis period. By monetising these factors, it becomes evident how maintenance scheduling decisions directly influence the broader economic and environmental footprint of the infrastructure.
