1. System Overview
The Climate-Responsive Asphalt Pavement System (CRAPS) is conceived as an advanced flexible pavement system designed to address the increasing impacts of climate change on road infrastructure. Rising average temperatures, more frequent heat waves, increased rainfall intensity, and greater variability in freeze–thaw cycles accelerate traditional asphalt deterioration mechanisms such as rutting, thermal cracking, moisture damage, and binder aging. Conventional pavement systems, which were largely designed for historical climate conditions, are therefore increasingly exposed to premature failure and rising maintenance costs.
CRAPS integrates climate-adaptive materials, improved drainage concepts, and data-driven maintenance strategies to enhance long-term performance and reliability. The system-level objective is not only to delay physical deterioration but also to reduce environmental burdens and life-cycle costs while maintaining high service availability. This merged system description combines risk-based condition assessment with life-cycle environmental and economic evaluation, providing a holistic whole-life perspective consistent with modern infrastructure systems engineering.
The analysis focuses on the asphalt wearing course, as it is the most climate-exposed layer and plays a dominant role in both deterioration risk and life-cycle impacts
2. Functional Unit and Geometry
To ensure transparency and comparability, a clearly defined functional unit and fixed geometry are adopted. The functional unit represents the service provided by the pavement rather than just material quantities, aligning with ISO-based LCA principles.
Functional unit: Asphalt wearing course for a 100 m long, two-lane roadway over a 30-year service period.
| Parameter | Value |
|---|---|
| Road length | 100 m |
| Number of lanes | 2 |
| Lane width | 3.5 m |
| Total pavement width | 7.0 m |
| Wearing course thickness | 0.05 m |
| Asphalt density | 2400 kg/m |
Keeping geometry constant across all design alternatives ensures that observed differences in environmental impact, cost, and performance are attributable to material choice and system behavior, not to volume effects.
3. Design Alternatives
Three wearing-course alternatives are evaluated, representing different responses to climate stress while remaining realistic and applicable in current engineering practice.
| Option | Description | Key Climate-Relevant Feature |
| HMA | Conventional Hot Mix Asphalt | High heat absorption, faster aging |
| Cool Pavement | Reflective coating on HMA | Reduces surface temperature by 5–10 °C |
| PMA | SBS Polymer-Modified Asphalt | Higher rutting and cracking resistance |
The conventional HMA option serves as a benchmark, while the Cool Pavement and PMA options represent climate-adaptive strategies focusing on thermal mitigation and material durability, respectively.
4. Risk-Based Condition Assessment
Risk-based assessment evaluates how pavement condition evolves over time under uncertainty caused by climate, traffic, material behavior, and maintenance actions. Instead of deterministic life estimates, probabilistic modeling captures the likelihood of being in different condition states at any point in time.
4.1 Condition States
A five-state condition classification is adopted, consistent with PCI/PASER-based pavement management systems. Each state reflects a distinct level of structural and functional performance.
| State | Condition | Typical Action |
| 1 | Excellent | No action, monitoring |
| 2 | Good | Preventive maintenance |
| 3 | Fair | Surface treatment / thin overlay |
| 4 | Poor | Structural overlay / major rehab |
| 5 | Failed | Full reconstruction |
4.2 Markov Chain Results
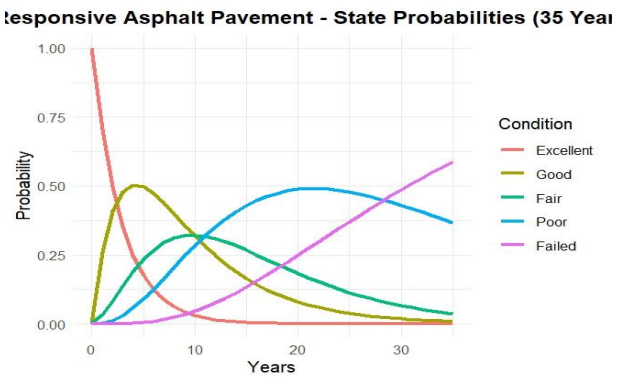
A discrete-time homogeneous Markov Chain is used to model transitions between condition states. Transition probabilities represent the combined effect of climate exposure, traffic loading, and material performance. Climate-responsive features reduce transition rates to worse states compared with conventional pavements.
Over a 35-year horizon, the model shows a gradual shift from high-probability Excellent and Good states toward Poor and Failed states, reflecting natural aging and accumulated damage.
Key findings from probabilistic deterioration modeling:
- Year 10: Pavement most likely in Good or Fair (~32% each)
- Year 20: Poor state dominates (~49%), failure risk rises sharply
- Year 30: Failed state becomes dominant (~49%)
- Year 35: Failure probability ≈ 59%, defining end of effective service life
5. Fault Tree Analysis (FTA)
Fault Tree Analysis complements the Markov model by identifying how and why failures occur. While the Markov Chain describes when deterioration happens, FTA explains the causal structure behind system failure.
5.1 Top Event
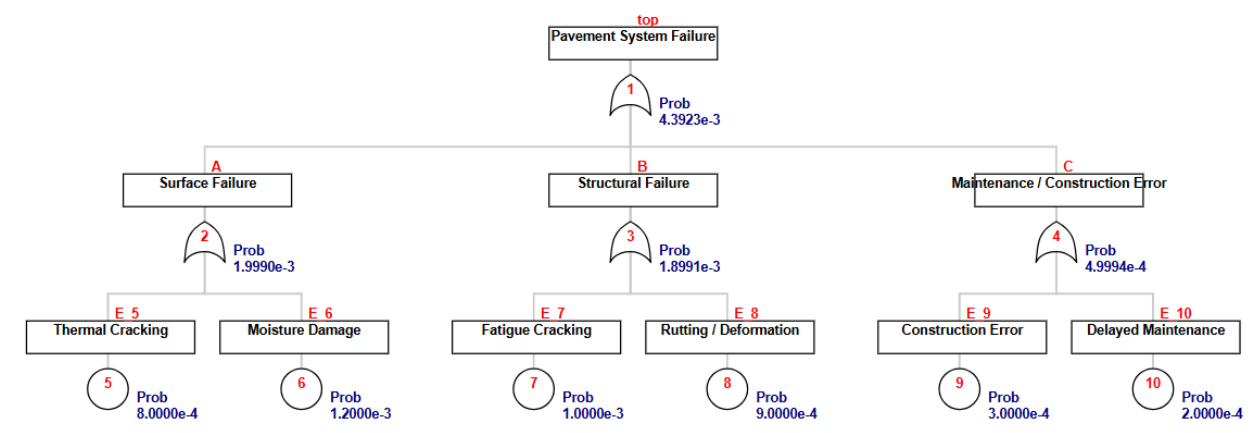
The top event is defined as Pavement System Failure, meaning loss of acceptable structural or functional performance. This event is decomposed into three main branches:
- Surface Layer Failure: driven by thermal cracking and moisture-induced stripping.
- Structural Layer Failure: driven by fatigue cracking and rutting under traffic loads.
- Maintenance / Construction Error: driven by poor compaction, delayed maintenance, or incorrect material selection.
Quantitative evaluation shows that surface and structural failures contribute almost equally to total risk, emphasizing the importance of climate-responsive surface materials and adequate structural support.
5.2 Main Failure Branches
| Branch | Contribution |
| Surface layer failure (thermal cracking, moisture damage) | ~48% |
| Structural failure (fatigue, rutting) | ~45% |
| Maintenance / construction error | ~7% |
Annual system failure probability ≈ 0.0044, indicating high reliability when maintenance is applied.
6. Reliability Metrics
Reliability analysis translates probabilistic results into performance indicators useful for engineering decision-making.
| Metric | Value | Interpretation |
| MTTF | 227.7 years | High inherent reliability |
| MTTR | 5.8 years | Fast recovery after failure |
| RAI | 0.975 | 97.5% system availability |
Although the MTTF exceeds the design life, it should be interpreted as a reliability indicator, not as a literal service life. It confirms that climate-responsive design significantly delays catastrophic failure when supported by maintenance.
7. Life-Cycle Assessment (LCA) Results
Life-Cycle Assessment evaluates environmental impacts from raw material extraction to end-of-life, following a cradle-to-grave system boundary. Traffic emissions and user delays are excluded to maintain focus on material and construction effects.
7.1 CO₂ Emissions
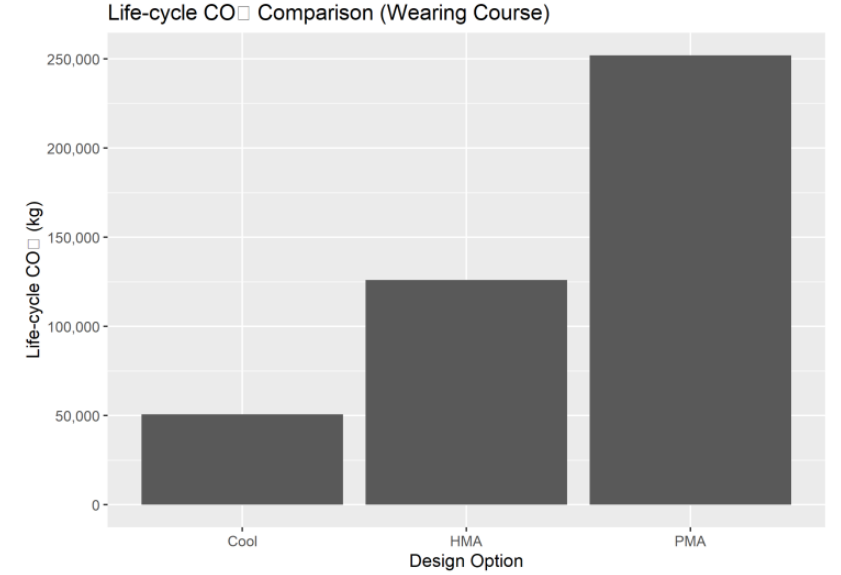
Carbon dioxide emissions represent the dominant climate impact category. Differences between options arise from binder production, polymer content, mixing temperatures, and maintenance frequency.
The Cool Pavement option achieves the lowest emissions due to reduced maintenance and thermal stress mitigation, while PMA exhibits the highest emissions due to polymer production despite its durability benefits.
| Option | CO₂ Emissions (kg) |
| Cool Pavement | ~50,000 |
| HMA | ~125,000 |
| PMA | ~250,000 |
7.2 Energy Consumption
Energy demand is dominated by asphalt production and placement. Conventional HMA requires high mixing and compaction temperatures, resulting in significantly higher cumulative energy use. Cool Pavement and PMA reduce life-cycle energy demand by extending service intervals and lowering maintenance frequency.
| Option | Life-cycle Energy |
| Cool Pavement | Very low |
| PMA | Low |
| HMA | >100,000,000 MJ |
High energy demand of HMA is driven by high mixing and compaction temperatures.
7.3 Atmospheric Pollutants
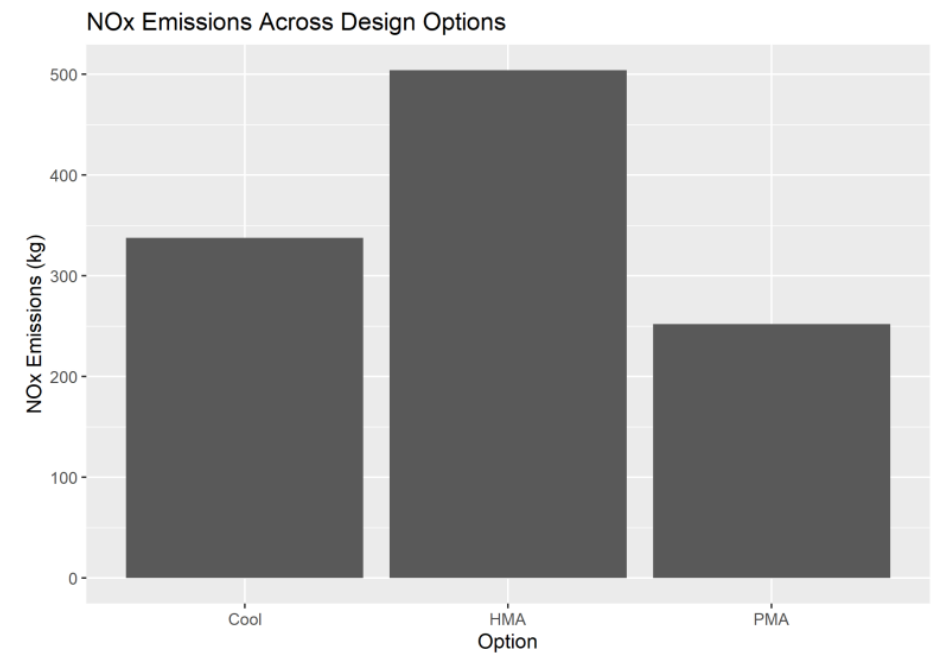
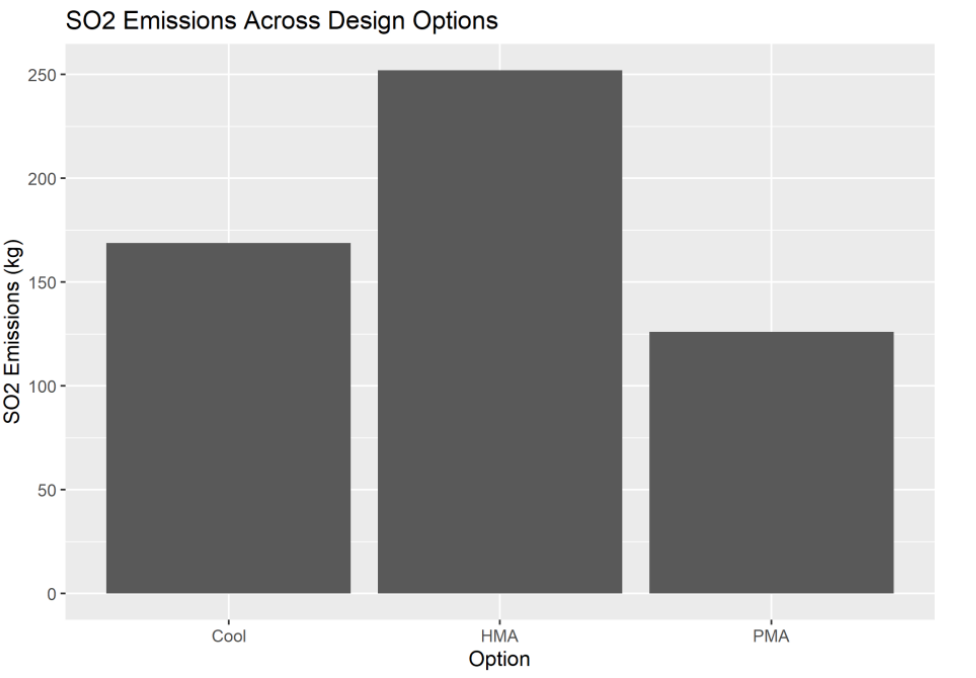
NOₓ and SO₂ emissions contribute to smog formation, acid rain, and public health impacts. HMA consistently shows the highest emissions due to energy-intensive production, while PMA performs best in these categories because of reduced maintenance needs.
| Pollutant | Cool | HMA | PMA |
| NOₓ (kg) | ~340 | >500 | ~250 |
| SO₂ (kg) | ~170 | ~250 | ~125 |
8. Life-Cycle Cost (LCC)
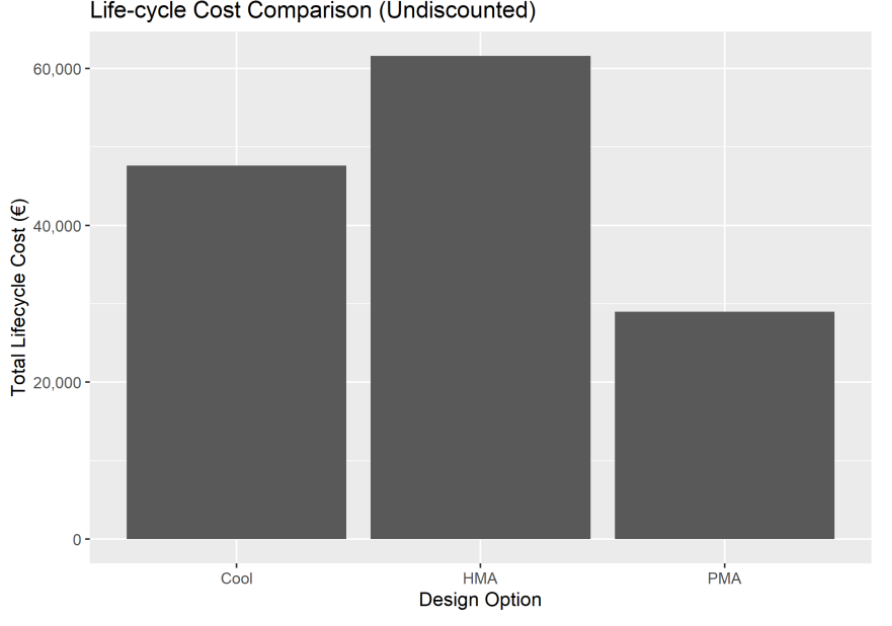
Life-cycle cost analysis accounts for initial construction, maintenance, and end-of-life costs over the analysis period. Costs are undiscounted to maintain transparency and comparability.
PMA exhibits the lowest total cost due to extended service life and fewer interventions, while HMA is the most expensive option because of frequent maintenance and earlier rehabilitation requirements.
| Option | Total LCC (€) |
| PMA | ~28,000 |
| Cool Pavement | ~48,000 |
| HMA | ~62,000 |
9. Environmental–Economic Trade-off
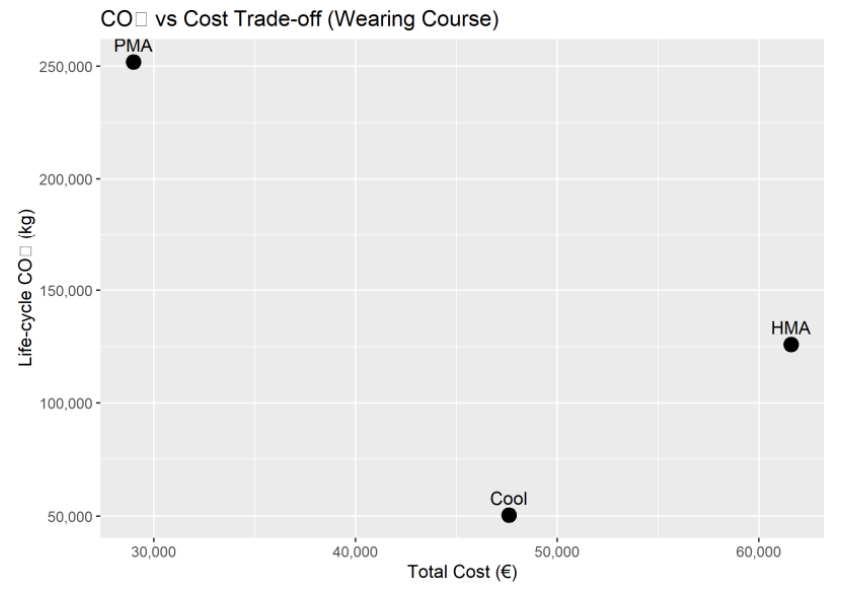
A combined analysis of CO₂ emissions and total cost highlights the inherent trade-offs between environmental and economic objectives. No single option dominates all criteria, demonstrating the need for multi-criteria decision analysis rather than single-metric optimization.
A scatter plot of CO₂ vs. Cost shows:
- PMA: Low cost, high emissions
- Cool Pavement: Low emissions, moderate cost
- HMA: High cost, mid-to-high emission
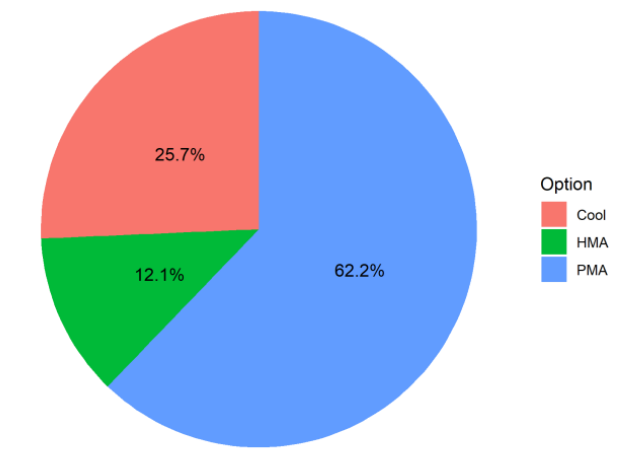
10. Multi-Criteria Decision Analysis (MCDA)
MCDA integrates environmental and economic indicators using AHP-based weighting. This approach reflects real-world decision-making, where sustainability and cost must be balanced rather than optimized independently.
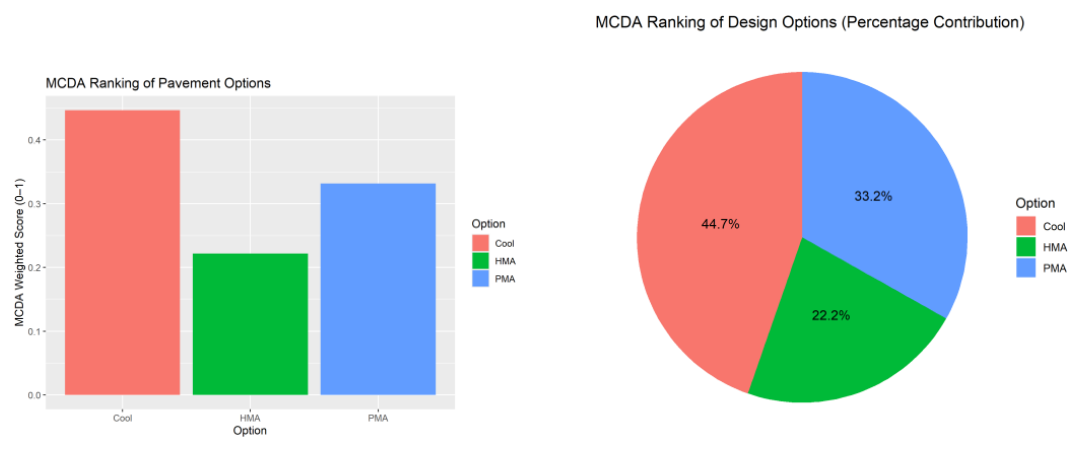
The results identify Cool Pavement as the best overall solution, as its environmental advantages outweigh its moderate cost increase relative to PMA.
Using AHP-weighted criteria (environmental + economic):
| Option | MCDA Rank |
| Cool Pavement | 1st |
| PMA | 2nd |
| HMA | 3rd |
Cool Pavement achieves the best balance between low environmental impact and acceptable cost.
11. Integrated Interpretation
By combining risk modeling, LCA, LCC, and MCDA, the CRAPS framework demonstrates how climate-responsive design improves reliability, reduces environmental impacts, and supports informed long-term decision-making. Each method reinforces the others, creating a coherent system-level understanding.
- Risk analysis shows CRAPS can reliably perform for 30–35 years with proactive maintenance.
- LCA identifies Cool Pavement as the environmentally superior option.
- LCC favors PMA economically, but at a high carbon cost.
- MCDA confirms Cool Pavement as the optimal overall solution.
12. Final Recommendation
Based on the integrated analysis, the Cool Pavement wearing course is recommended as the most balanced and sustainable solution for climate-resilient highway infrastructure. It provides substantial environmental benefits while maintaining acceptable life-cycle costs and robust system reliability.
References:
- ISO. (2006). ISO 14040:2006 — Environmental management: Life cycle assessment — Principles and framework. International Organization for Standardization, Geneva.
- ISO. (2006). ISO 14044:2006 — Environmental management: Life cycle assessment — Requirements and guidelines. International Organization for Standardization, Geneva.
- Harvey, J. T., Meijer, J., Ozer, H., Al-Qadi, I. L., Saboori, A., & Kendall, A. (2016). Pavement Life-Cycle Assessment Framework (FHWA-HIF-16-014). Federal Highway Administration (FHWA), U.S. Department of Transportation.
- Walls, J., & Smith, M. R. (1998). Life-Cycle Cost Analysis in Pavement Design (FHWA-SA-98-079). Federal Highway Administration (FHWA), U.S. Department of Transportation.
- Qiao, Y., Dawson, A., Parry, T., & Flintsch, G. (2020). Flexible pavements and climate change. Sustainability, 12(3), 1057.
- Gudipudi, P. P., Underwood, B. S., & Zalghout, A. (2017). Impact of climate change on pavement structural performance in the United States. Transportation Research Part D: Transport and Environment.
- Swarna, S. T., & colleagues. (2022). Climate change impact and adaptation for highway asphalt pavements. Canadian Journal of Civil Engineering.
- United States Environmental Protection Agency (EPA). (2025). Using Cool Pavements to Reduce Heat Islands. EPA Heat Island Compendium (web guidance page).
- Li, H., & colleagues. (2025). Investigation on reflective/cool pavement coatings and temperature reduction (reported 3–15 °C range). Engineering (Engineering.org.cn).
- Wu, B., & colleagues. (2021). Effect of polymer modifiers on long-term performance of asphalt mixtures (SBS improves rutting/cracking/water stability). Materials (PMC article).
- Molenaar, A. A., & colleagues. (2011). SBS polymer modified bitumen improves resistance to cracking and rutting. TRB TRID record: SBS Polymer Modified Base Course Mixtures for Heavy Duty Asphalt Pavements.
- Butt, A. A., Shahin, M. Y., Feighan, K. J., & Carpenter, S. H. (1987). Using the Markov process as a pavement management tool. Transportation Research Record, 1123.
- IEC. (2006). IEC 61025:2006 — Fault tree analysis (FTA). International Electrotechnical Commission, Geneva.
- Saaty, T. L. (1980). The Analytic Hierarchy Process: Planning, Priority Setting, Resource Allocation. McGraw-Hill, New York.
- Saaty, R. W. (1987). The analytic hierarchy process—what it is and how it is used. Mathematical Modelling, 9(3–5), 161–176.